
Bitcoin noted a brief spike past $14,000, before being rejected, with the cryptocurrency trading at $13,700, at press time. The crypto-space was ecstatic about BTC closing a monthly candle above $13k, but some traders also expected a pullback before another move upwards.
Further down the crypto-ladder, Bitcoin Cash noted consistent buying volumes, but was unable to flip and hold on to a level of resistance. Waves too tested its resistance but was rejected, while Enjin lost a level of support to the bears.
Bitcoin Cash [BCH]
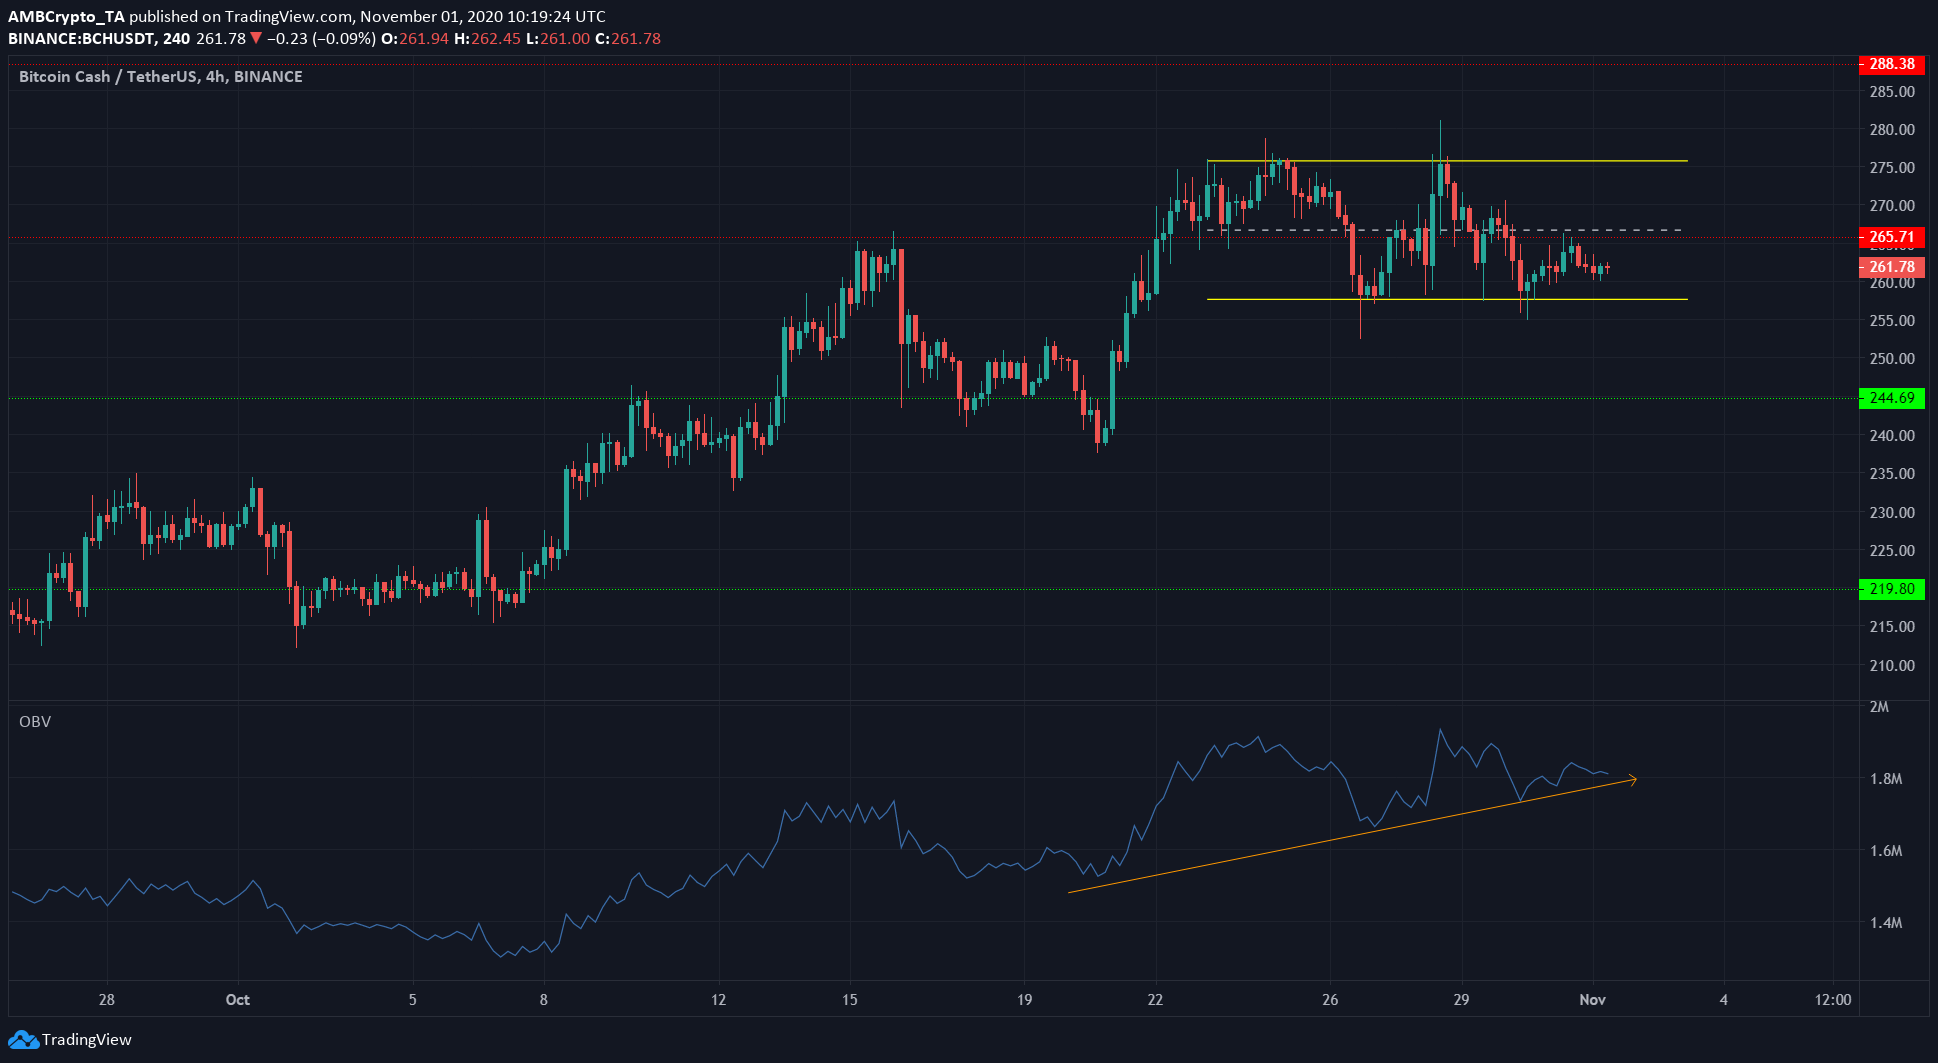
Source: BCH/USDT on TradingView
Bitcoin Cash was trading within a rectangle pattern (yellow), with a level of resistance at $265 in the middle of the pattern. The past few days have seen the price oscillate around that level.
However, the OBV showed that the buying volume has been consistently trending upwards as it formed a series of higher lows.
A rising Bitcoin could help BCH’s price as well since the two crypto-assets are quite closely correlated. A close beneath the rectangle for BCH could see it test the support level at $245.
Waves [WAVES]
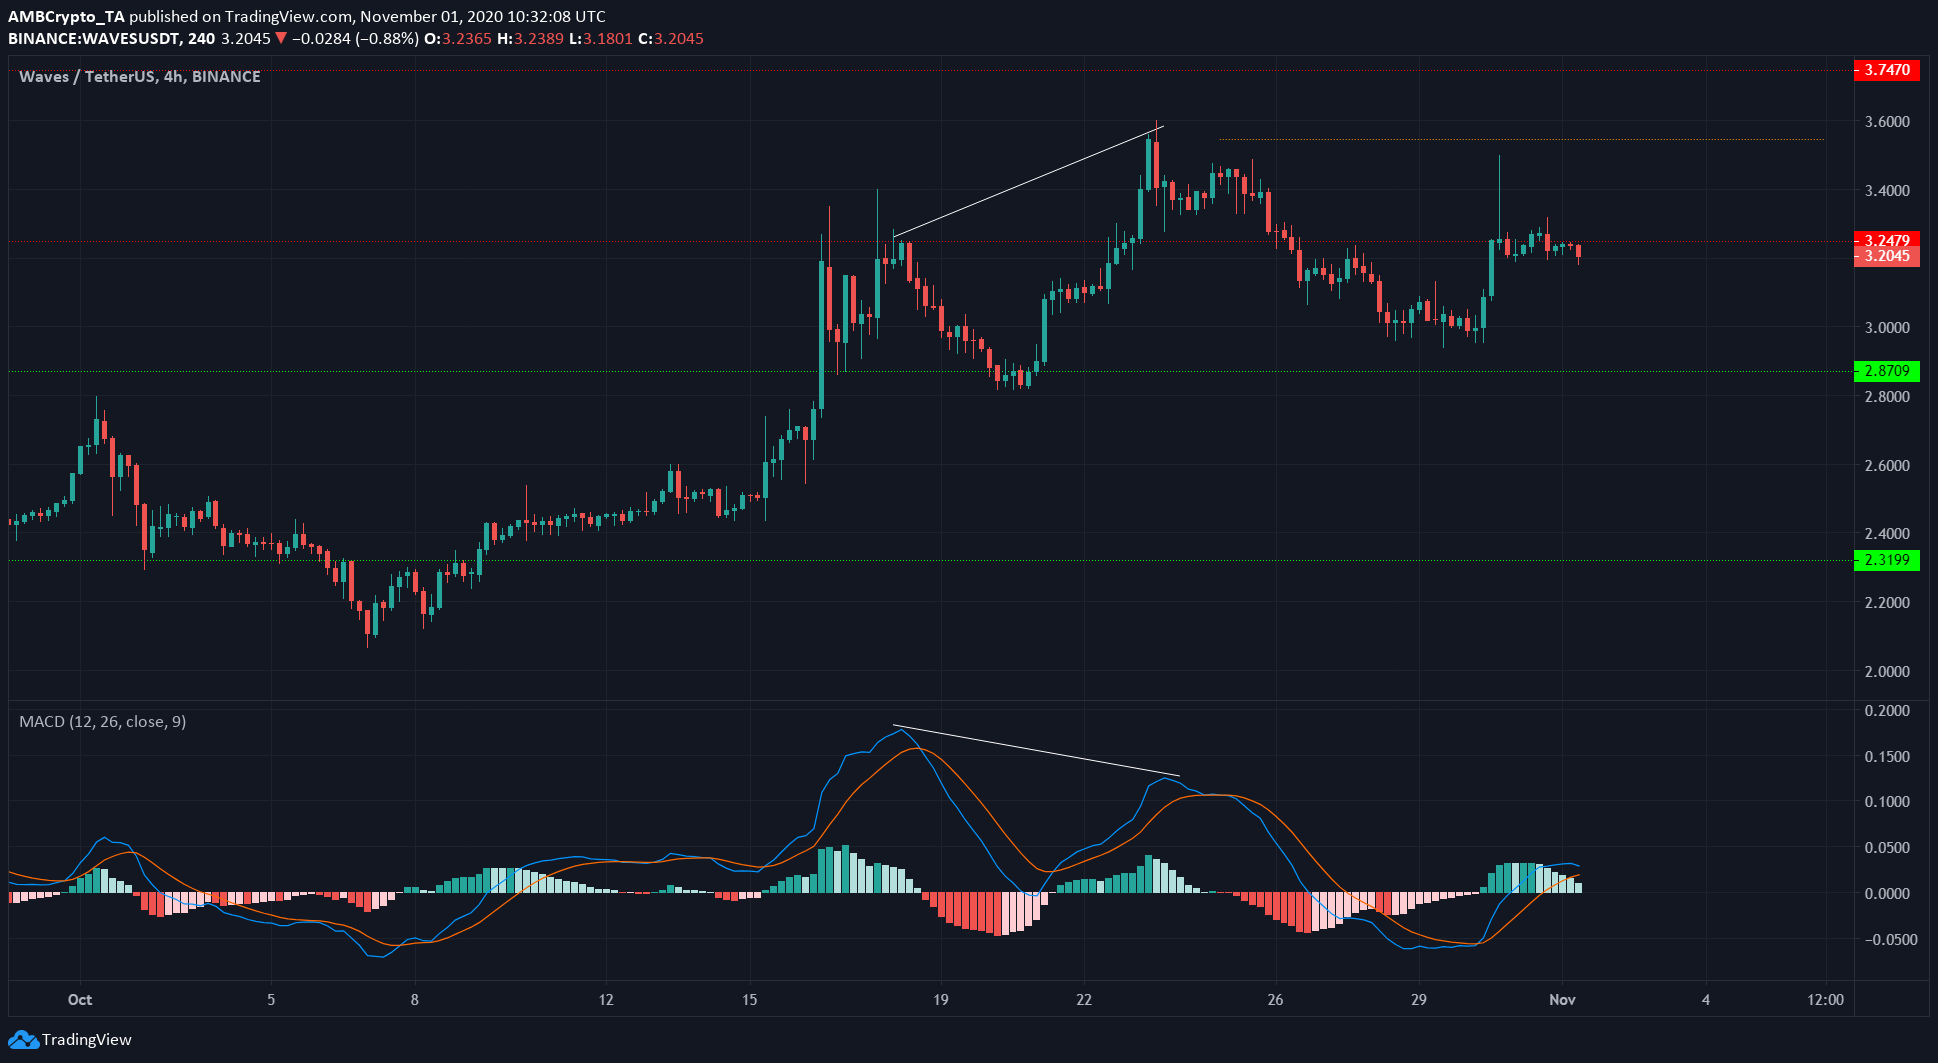
Source: WAVES/USDT on TradingView
Highlighted in white was the bearish divergence between the price and the momentum the crypto-asset exhibited a few days ago. The price retreated toward the support at $2.87 and attempted to climb past the $3.24 resistance level once more.
While the MACD moved above zero and formed a bullish crossover over the past few days, a failure to reclaim the resistance in the coming days could spell bearishness for WAVES.
Enjin [ENJ]
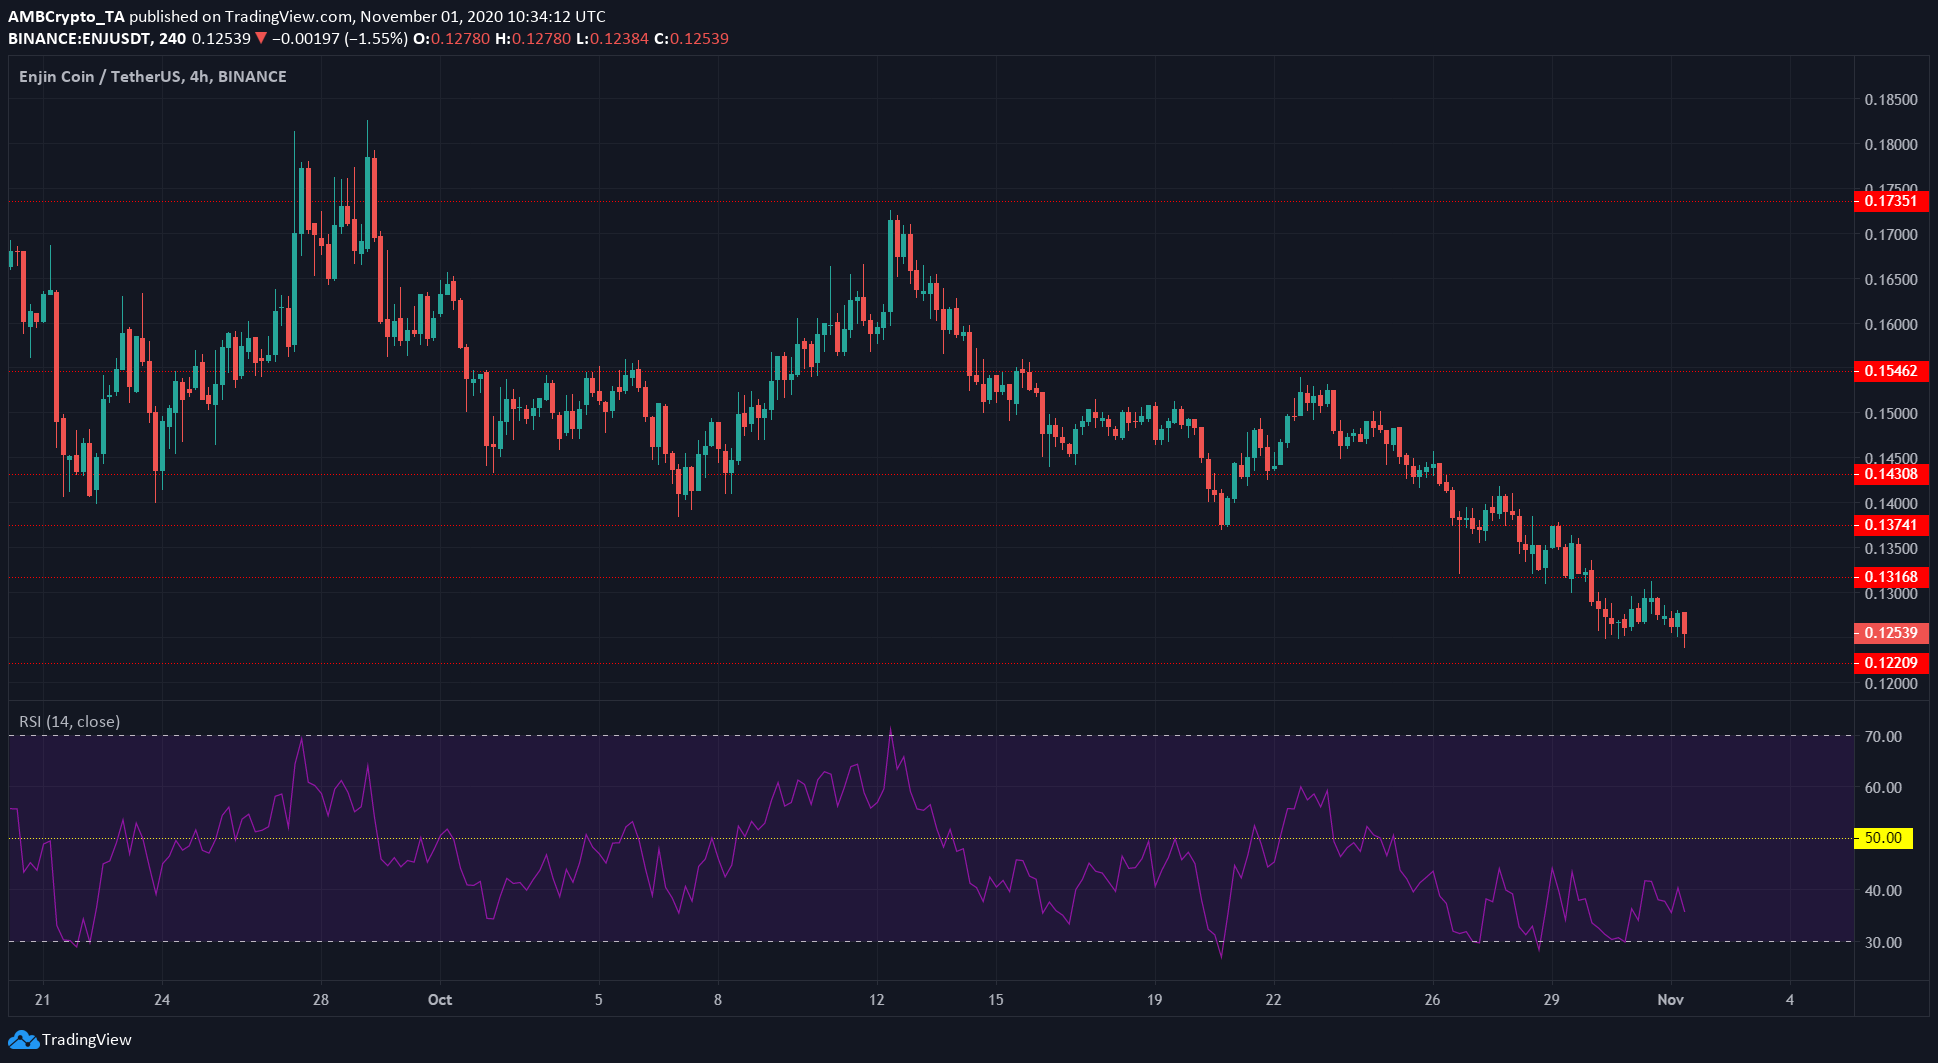
Source: ENJ/USDT on TradingView
Enjin has been posting steady losses over the past week. From September to mid-October, ENJ has traded within the range of $0.142-$0.172.
On a longer-term basis, a close beneath this range indicated that ENJ could be headed to $0.11.
In the short-term, the RSI highlighted the bearish momentum behind the crypto-asset. The indicator noted a reading of 36, at press time, with the same oscillating between 30 and 40 over the past week.
In related news, Enjin CTO Witek Radomski featured in an AMA with Binance US a few days ago and touched upon the topic of Efinity.
The post appeared first on AMBCrypto


