
Bitcoin’s price had seen a four-day decline of over $1150, while the altcoins suffered even harder.
Despite that Bitcoin is currently trading around the consolidation range from a week ago, we cannot ignore this week’s false breakout to $12,500. This turned to be a fake-out, and the bearishness that came out of this is clearly seen on the following days.
As can be seen on the 4-hour chart, BTC was forming a bullish triangle ($12K as an upper angle), and even after the above mention false breakout, the formation was kept until yesterday.
The triangle pattern got broken around $11700, sled down to the $11600 support, retested the triangle (this time as resistance): From there, the way to another leg down was quick.
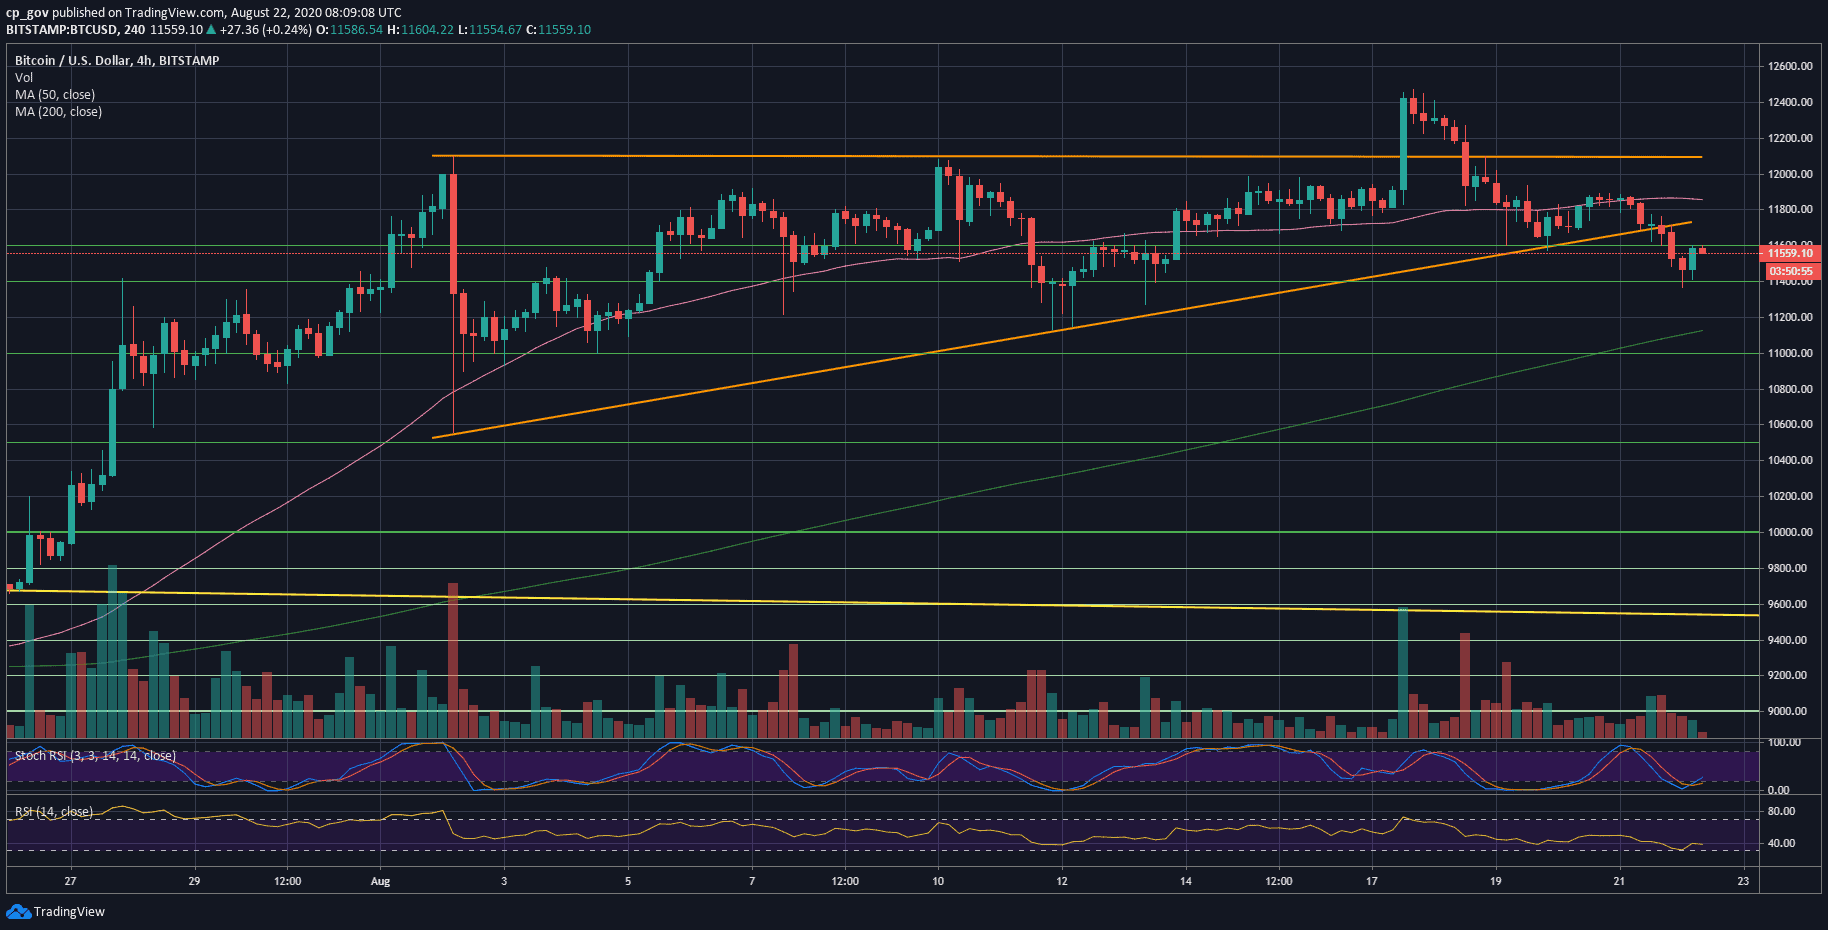
As of writing these lines, Bitcoin found support upon the $11400 level. The latter was the July high that served as resistance before the first surge to $12K on the first day of August. The technical analysis states that strong resistance becomes strong support, and so far, this is seen in the case here.
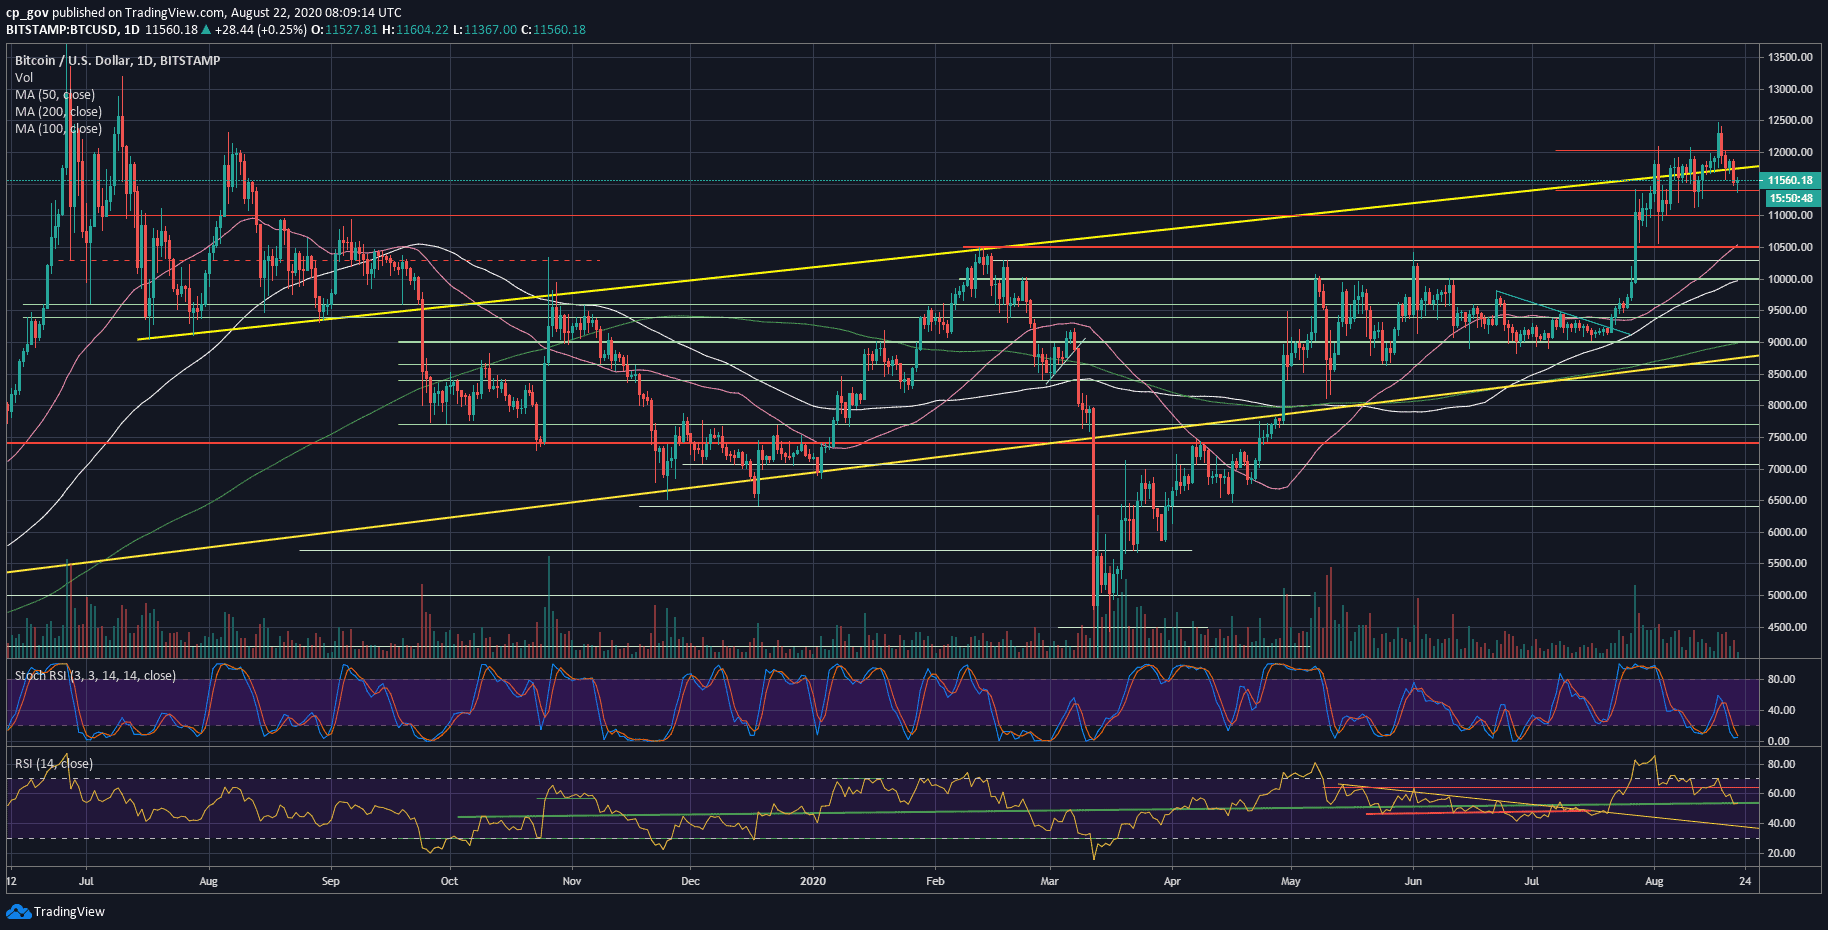
On the macro level: The bigger picture is indeed bullish, but there is a warning sign on the macro level as well. looking at the following daily chart, there is the yellow ascending trend-line, which started forming in July 2019. Bitcoin price is now trading below the line for the first time in ten days.
Key Support and Resistance For Bitcoin’s Short-term
Today’s candle is not over yet, and we might see a correction to the $11,600 – $11,800 levels: Stochastic RSI is at its oversold levels on both 4-hour and 1-day chart, daily RSI is facing huge support line around 50-52. However, until resettling above $12K – $12.1K, in my opinion – the correction is not over yet.
From the bearish side, the first level of support is today’s low, $11,400. If Bitcoin fails to hold, then $11,200 (weak) and $11,000 are the next possible support areas.
Further below lies $10,800 and $10,500, which is the prior 2020 high, along with the 50-days moving average line (the pink line on the daily chart).
Total Market Cap: $360.3 billion
Bitcoin Market Cap: $214 billion
BTC Dominance Index: 59.4%
*Data by CoinGecko
BTC/USD BitStamp 1-Day Chart
Click here to start trading on BitMEX and receive 10% discount on fees for 6 months.
Disclaimer: Information found on CryptoPotato is those of writers quoted. It does not represent the opinions of CryptoPotato on whether to buy, sell, or hold any investments. You are advised to conduct your own research before making any investment decisions. Use provided information at your own risk. See Disclaimer for more information.
The post appeared first on CryptoPotato


