
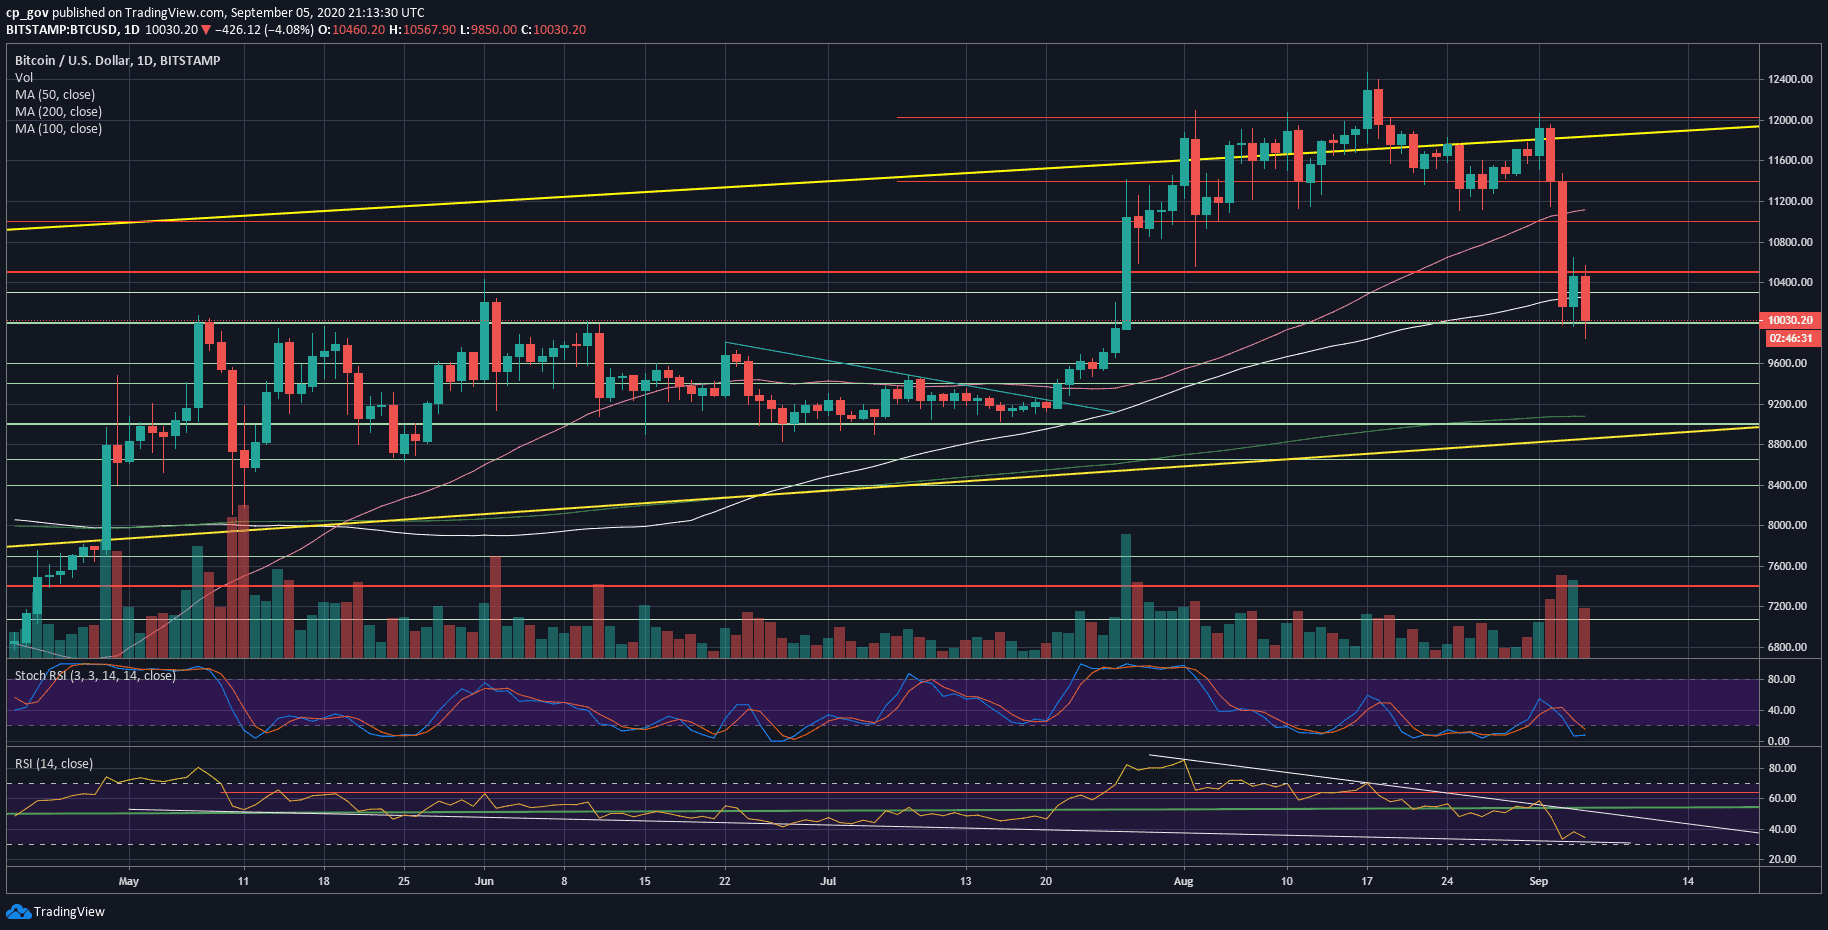
Just four days ago, one Bitcoin was trading for over $12,000. However, the cryptocurrency markets followed the global markets, and as of writing these lines Bitcoin fights to close the daily candle above $10,000.
If the bad blood coming from the equity markets was not enough, then came the SUSHI sell-off by its creator. This led the defi tokens, mainly Ethereum, to severe drops, which did not skip Bitcoin as the primary cryptocurrency.
As of now, Bitcoin marks $9850 as of today’s low, which is an intraday loss of $600. $9850 is also the lowest BTC price recorded since July 26, 2020.
Key Support and Resistance For Bitcoin’s Short-term
The critical level here is $10,000. There is not much time left for the daily close, and Bitcoin will look to finish today and tomorrow’s candle (the weekly) above $10,000.
In case Bitcoin losses the 5-figures number, then $9800 will be the next support. Further below lies $9600, which is also the CME gap.
If the latter does not hold, then the next support could be found at $9400, followed by the 200-days moving average line at $9100.
On the other hand, there is a high chance that we will see a correction after so much blood. The first level of resistance now becomes the 100-days moving average line at $10,250 (the white line on the daily chart). This is followed by $10,500 – the previous 2020 high before August.
Further above lies $10,800 and $11,000 – $11,100, along with the 50-days moving average line (marked pink on the following daily chart).
From a technical point of view, the RSI is nearing an oversold level. This supports the option of some bullish correction. Adding to the above, there is a little bit of bullish divergence on the 4-hour RSI.
As opposed to the above, the last drops were followed by a huge amount of volume. This is in favor of the bears. Thursday’s sell-off volume was the highest over the past 30-days. So short term, we might be a temp correction; however, mid-term is still bearish until proved otherwise (a weekly close above $11,000).
Total Market Cap: $323 billion
Bitcoin Market Cap: $185 billion
BTC Dominance Index: 57.3%
*Data by CoinGecko
BTC/USD BitStamp 1-Day Chart
BTC/USD BitStamp 4-Hour Chart

Click here to start trading on BitMEX and receive 10% discount on fees for 6 months.
Disclaimer: Information found on CryptoPotato is those of writers quoted. It does not represent the opinions of CryptoPotato on whether to buy, sell, or hold any investments. You are advised to conduct your own research before making any investment decisions. Use provided information at your own risk. See Disclaimer for more information.
The post appeared first on CryptoPotato


