
Over the past days, Bitcoin had gone through sideways price action, flirting with the range between $9500 and $9900.
The breakout of the $10,000 target is remarkably close. However, it also feels close as well to a massive price dump. Remember, from a technical point of view, the fact that Bitcoin so far fails to break the $10K benchmark level, along with the declining amount of volume means that every tryout becomes weaker.
The Golden Cross Is Here
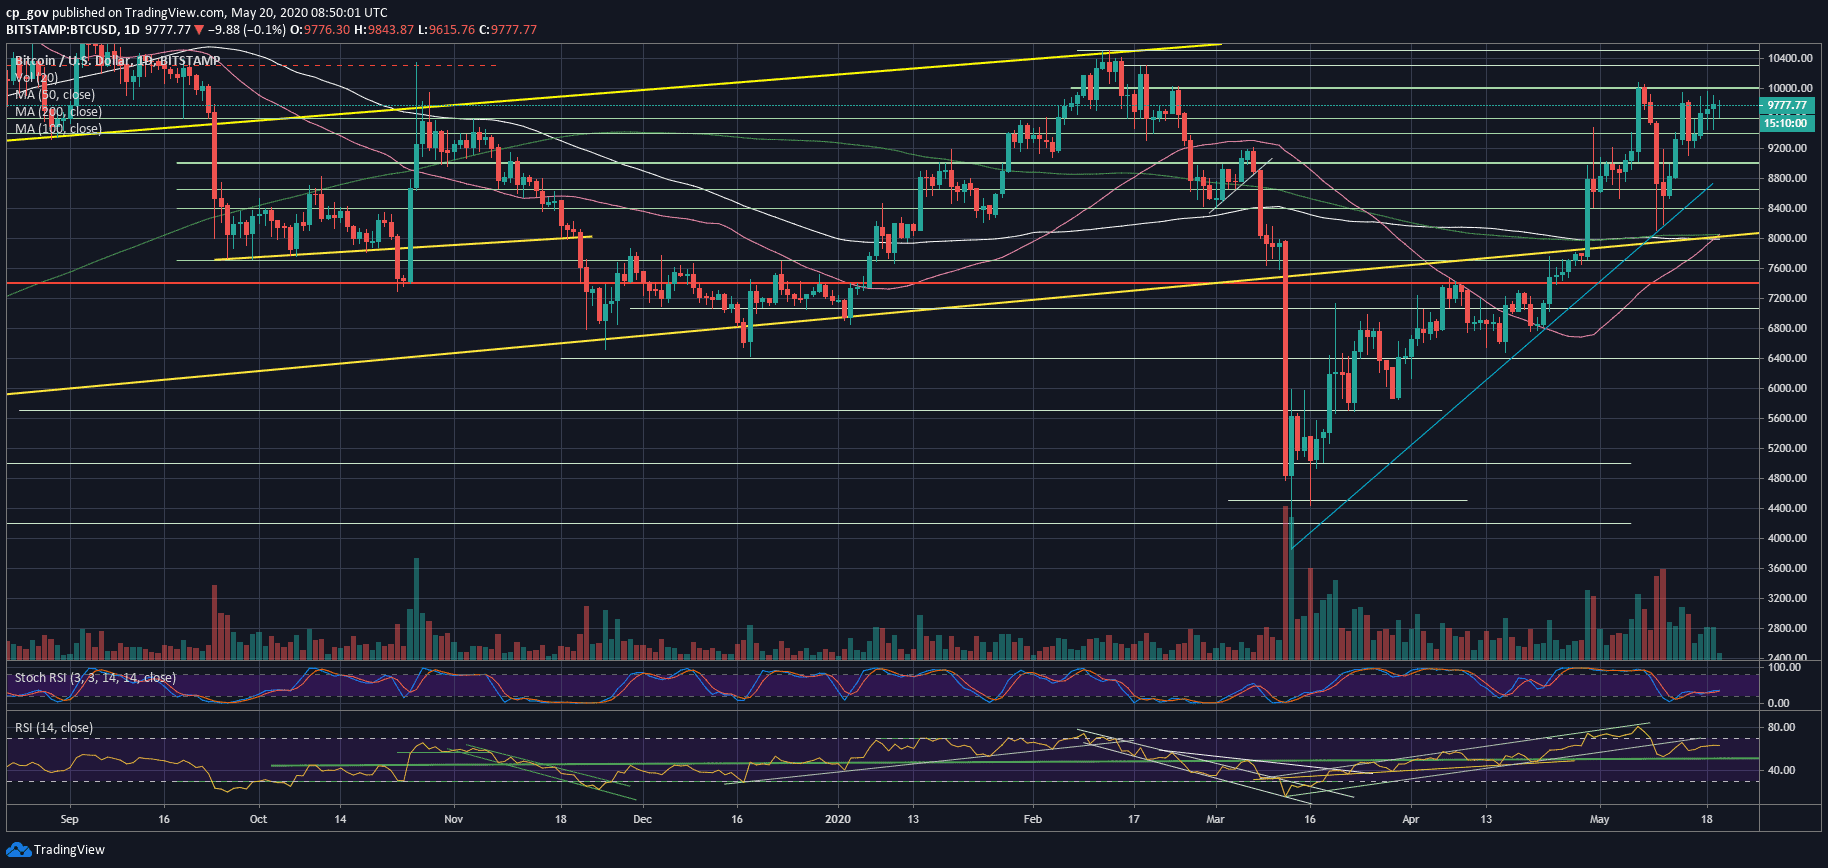
A Golden Cross is a long-term bullish signal, which occurs basically when the 50-days moving average line (marked pink on the following daily chart), is crossing above the 200-days moving average line (marked light green).
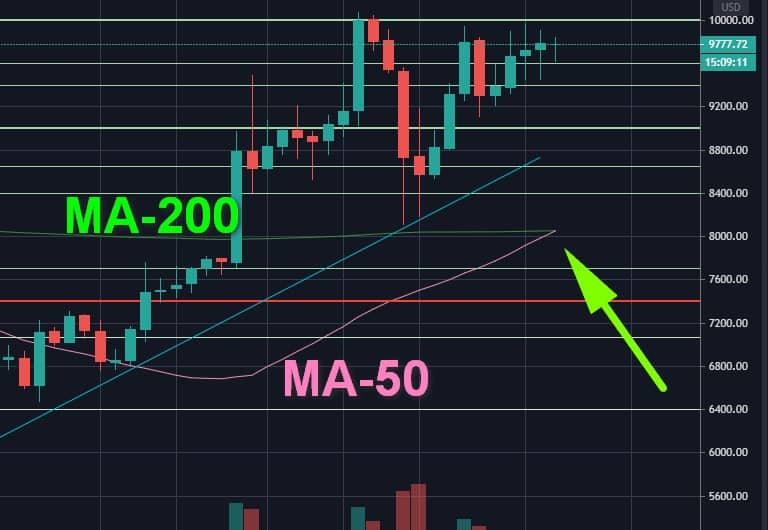
In the short history of Bitcoin, two of the most famous Golden Cross incidents took place at the end of 2015, which was the official start of the 2017 Bull-run and on April 2019, which was the official start of the 2019 mini bull-run, when Bitcoin reached almost $14K by last June (the highest price over the past 2.5 years).
One thing to keep in mind is that we did see a Golden Cross back in February, just three months ago, but it quickly turned into a fake-out, which ended with a Death Cross (the opposite) just a month after. So nothing is for sure, and fake-outs like this happen.
What is the immediate price effect?
Golden Cross is considered a lagging indicator. In other words, the positive momentum had already started, while the cross ‘confirms’ it. Apart from a form of hype that can develop and might assist the price to cross the $10,000 mark finally, the effect should be felt in a longer period of time.
Back To The Micro Level: $10K Or Not?
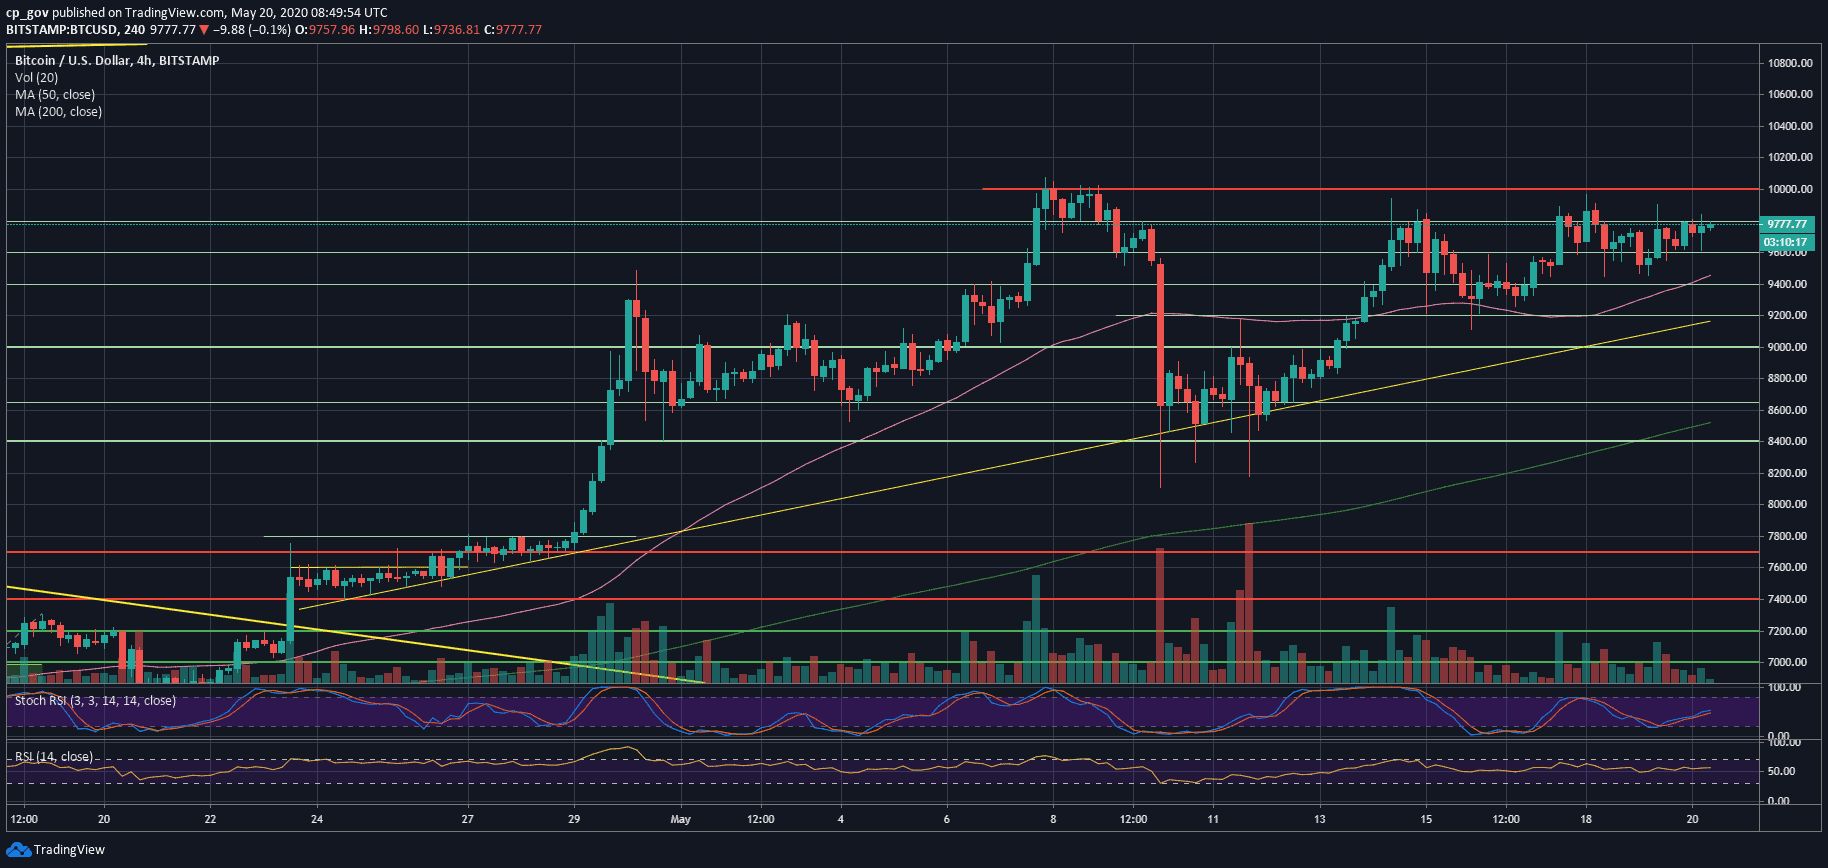
As we stated here two days ago, Bitcoin had gone through three failed attempts to break the $10,000 mark.
When looking at the trading volume and the declining daily candles, together with the indecisive state of the RSI indicator, we can comfortably say that a wild move is coming. Only time will tell whether it is going to be the breakout of the $10K or a rough dump back to the $9K area. To be more accurate – it’s likely that only hours or a few days will tell.
In case of a breakout, key resistance to watch: $10,200 (weak), $10,500 (strong), $10,800, $11,000.
In case of a break-down, key support levels: $9600, $9300 – $9400, $9100, $8900.
Total Market Cap: $267.6 billion
Bitcoin Market Cap: $179.1 billion
BTC Dominance Index: 66.9%
*Data by CoinGecko
BTC/USD BitStamp 4-Hour Chart
BTC/USD BitStamp 1-Day Chart
The post Bitcoin Golden Cross Just Happened: What Does It Mean For The BTC Price? Analysis & Overview appeared first on CryptoPotato.
The post appeared first on CryptoPotato


