
For those of you who are trading crypto for a few years, it will not be a surprise. While Bitcoin saw its worst day during March 12, 2020, resulting in more than 50% intra-day loss, it felt like a matter of time until Bitcoin will make its pave back to $8K – the price it was at before the collapse.
Just an hour ago, Bitcoin did it: It took a little more than 1.5 months, but Bitcoin captured the $8,000 once again. 120% ROI.
As we have seen in our previous price analysis, the bullish momentum was anticipated to reach this zone, but what’s next?
The Real Test
As of writing these lines, Bitcoin touched $8001 on Bitstamp and retracted a bit: however, once you are reading this, the price of Bitcoin might be different.
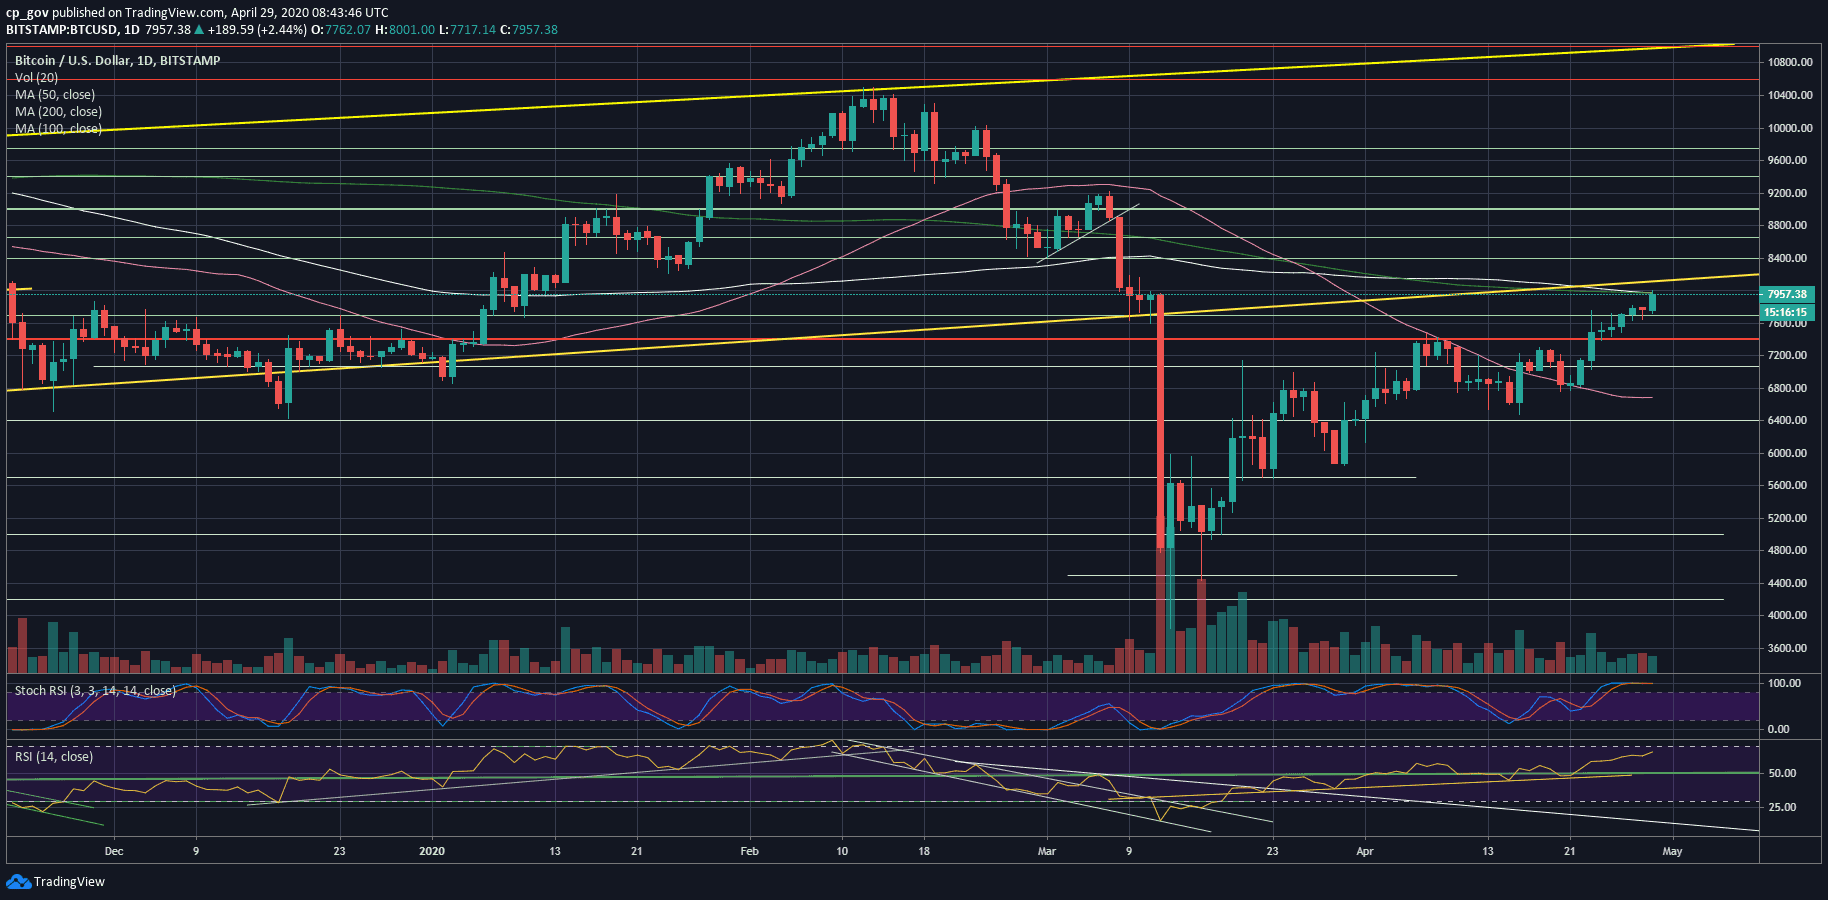
Bitcoin is now entering a serious zone of resistance between $8000 and $8200.
Along with the psychological level of $8K, this tough zone contains the significant 200-days moving average line (light green), and the 100-days MA (white), as can be seen on the following daily chart.
Besides, there is also a long-term, one-year-old ascending trend-line. This line was started forming at the beginning of April 2019. Some will say the official end of the 2018 bear market. Bitcoin lost this line as support, guess when? Right, on March 12, 2020.
Total Market Cap: $228.3 billion
Bitcoin Market Cap: $145.5 billion
BTC Dominance Index: 63.7%
*Data by CoinGecko
Key Levels To Watch & Next Possible Targets
– Support/Resistance levels: As mentioned above, the first major level of resistance is now $8000 – $8200.
In case Bitcoin can break above, then the next target would be $8400, followed by $8650 and further above $9000.
From below, the first level of support now lies at the previous resistance at $7700 – $7800. This is followed by $7600 and $7400.
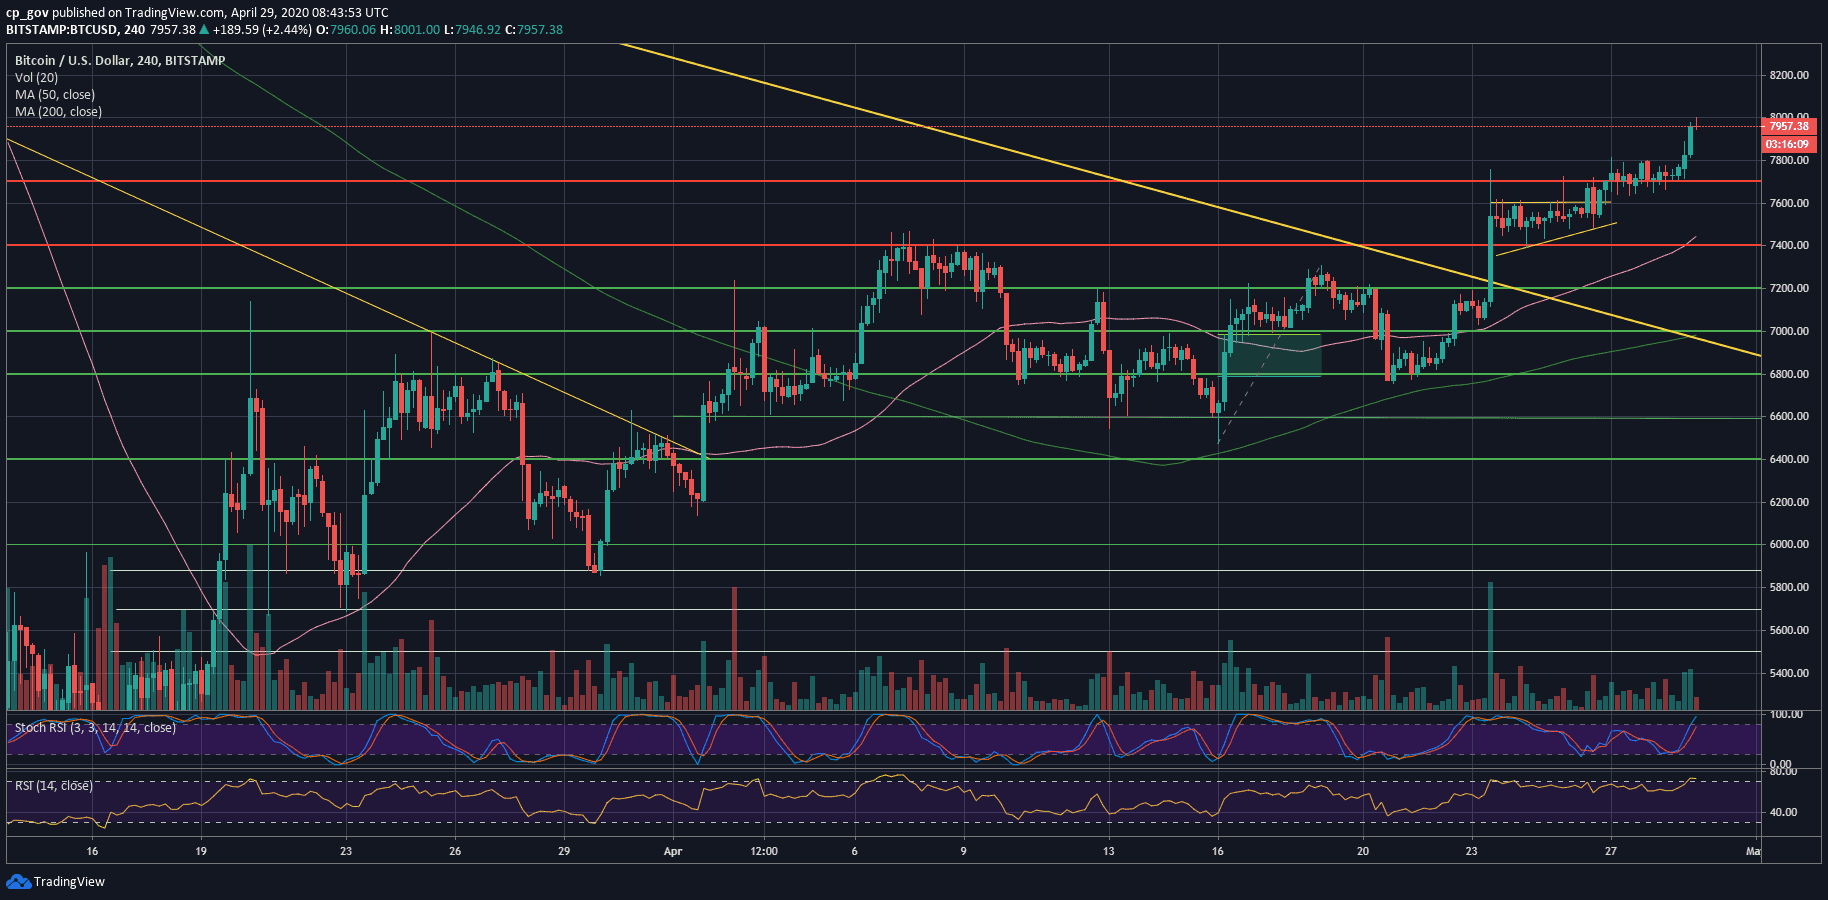
– The RSI Indicator: The RSI continues to support the bullish trend. The RSI is at 66, which is its highest level since February 14, while Bitcoin was trading above $10,000.
The indicator is overextended both on the 4-hour and the daily chart, which may send the cryptocurrency to a little correction before continuing above.
– Trading volume: Despite the excitement and the bullishness, the trading volume is still not significant, and had been declining since March 12. We will need to see how today’s volume candle will end.
BTC/USD BitStamp 4-Hour Chart
BTC/USD BitStamp 1-Day Chart
The post Bitcoin Just Reached $8,000: 120% and Recovery Since March-12 Collapse, But Now Facing The Real Trouble Zone (BTC Price Analysis) appeared first on CryptoPotato.
The post appeared first on CryptoPotato


