
At the moment, analyzing Bitcoin’s price chart is like taking aim in the dark. It is an unfamiliar trading range and it was last witnessed during January 2018. With the current market being extremely bullish over the last month, correction still awaits BTC’s market hence we will analyzing a couple of scenarios that may play over the next few weeks.
Bitcoin 1-day chart: Bullish and Bearish
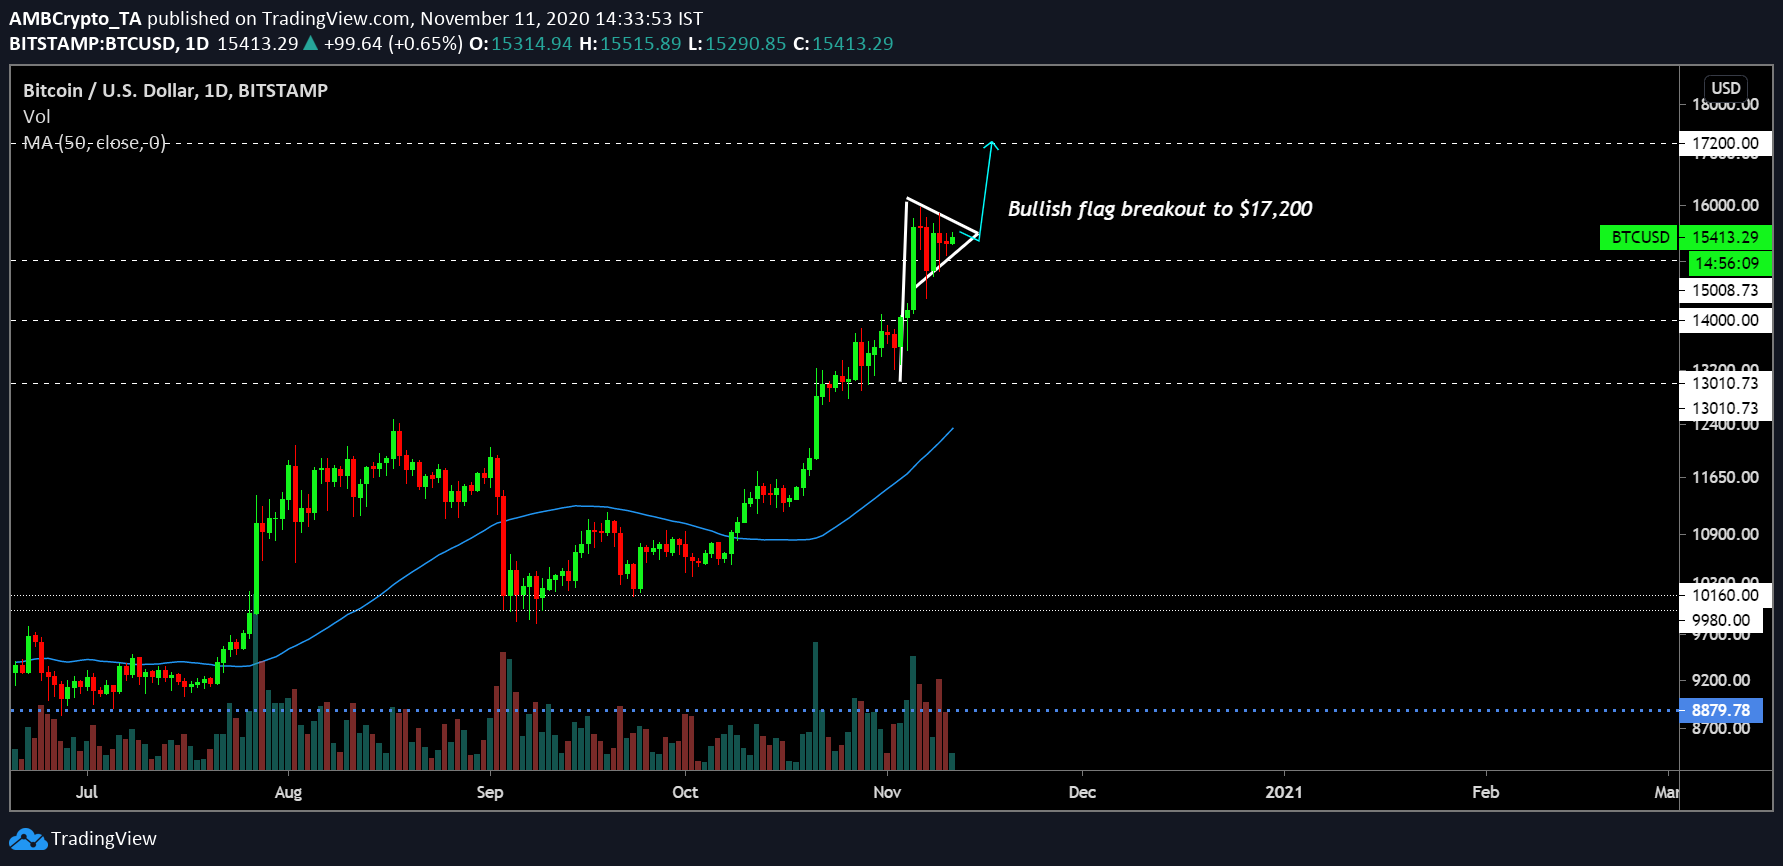
Taking the bullish step forward, Bitcoin is currently consolidating above $15,000. The sustenance is already impressive but currently, Bitcoin can be observed forming a bullish flag. With a bullish flag, the chances of another rapid spike improve which may see the asset re-test resistance at $17,200. At the moment, the 50-Moving Average is nicely thrusting underlying support and consistent trading volume suggested the validity of the present price range.
However, the same chart can be flipped on its head and a bearish pattern can be identified.
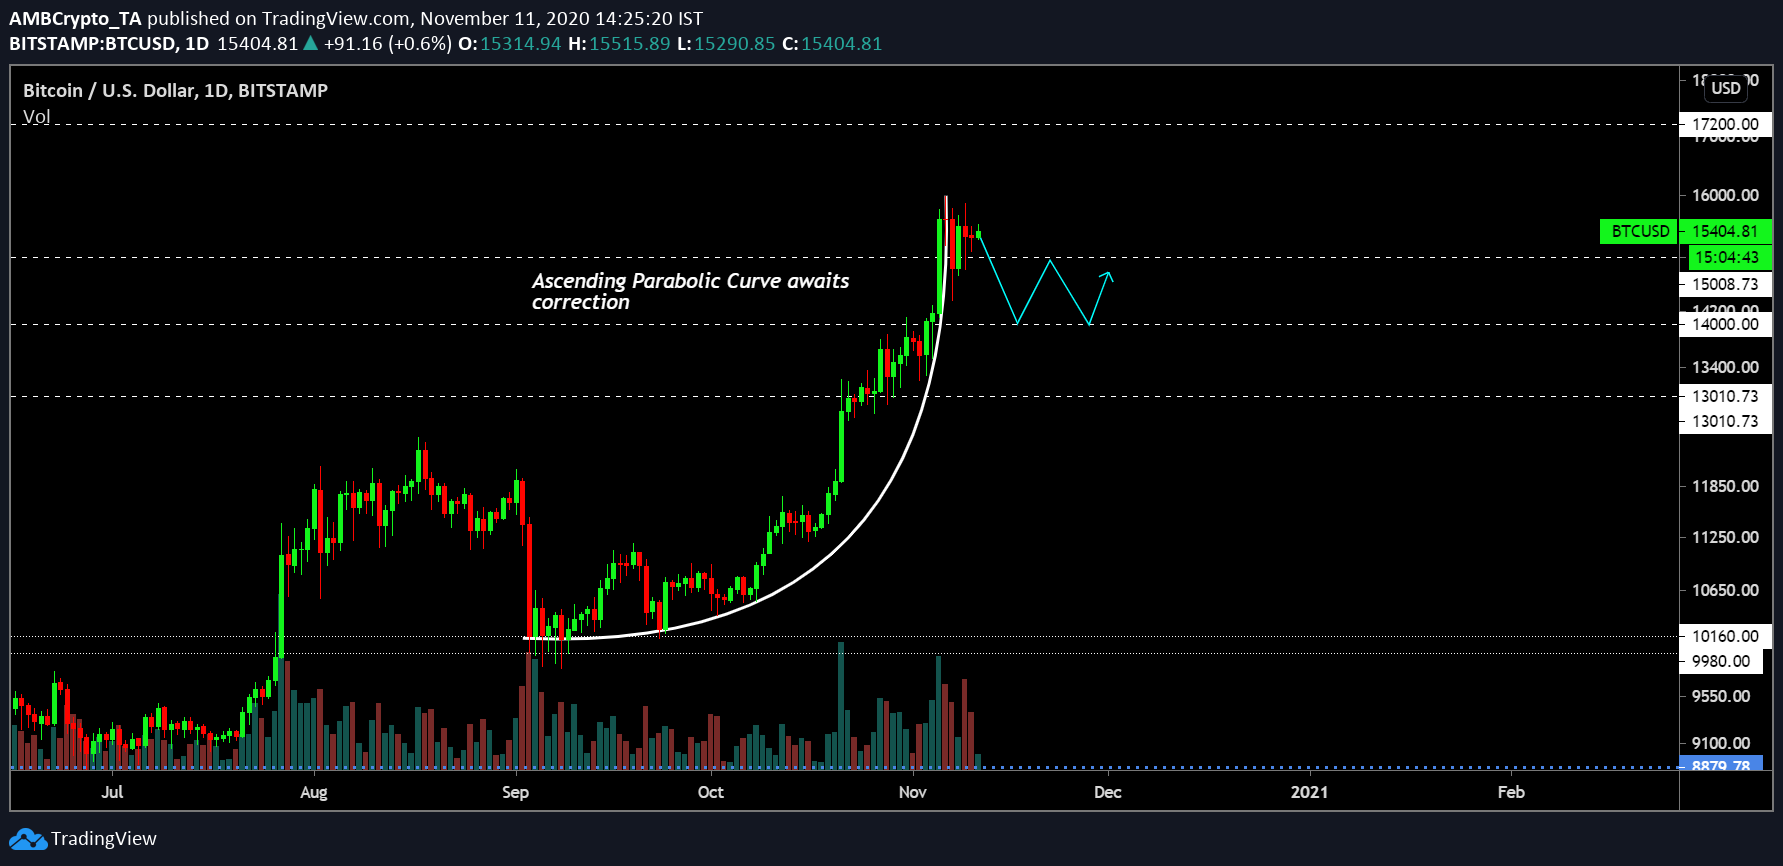
As illustrated in the above chart, an ascending parabolic curve can be pictured with respect to the price candles and the valuation is now consolidating at the top. From here, a brief period of a correction down to $14,000 is a certain possibility. There can be sideways movement between $14k-$15k before another rally but testing immediate support is definitely foreseeable.
The difference in trends between the charts can be further validated with the market indicators.
Reasoning
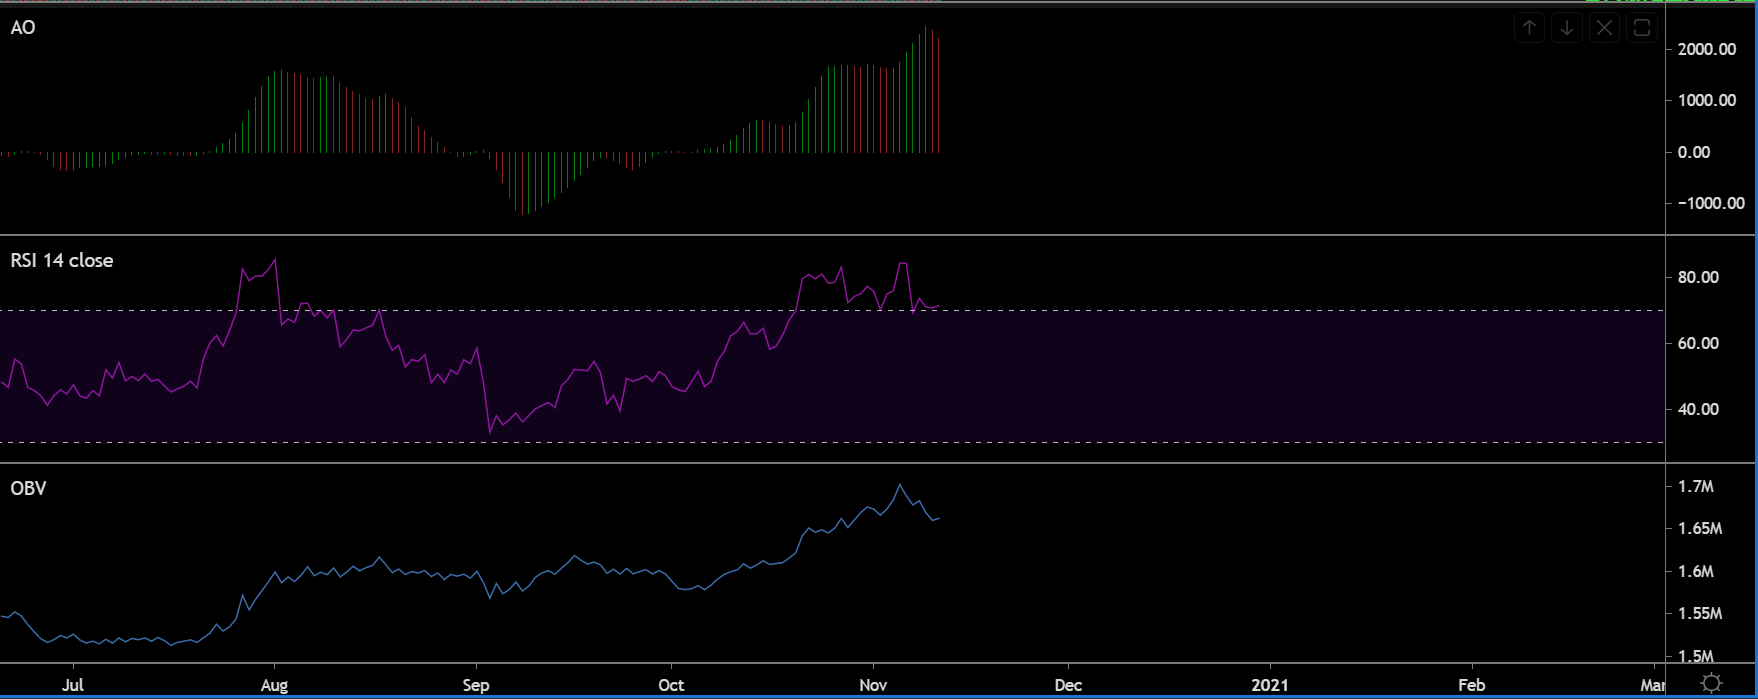
From a technical perspective, all the market indicators currently lean towards a period of correction as well. Awesome Oscillator is beginning to flip towards bearish momentum as red candles appear in the chart.
Relative Strength Index or RSI has been at an overbought region for close to a month, waiting for a pullback from the sellers. On-balance volume is currently at a significant high as well and profits sellout would usually take precedence at this range, taking advantage of retail FOMO.
Conclusion
With the US-elections finally put to bed, Bitcoin can rally on its own at the moment and market sentiment was extremely bullish. However, a period of correction will have long-term benefits on its price. It is ‘pick and choose’ at the moment, with BTC leaning towards both the trend.
The post appeared first on AMBCrypto


