
After Bitcoin’s significant rally to above $10,000, centralized exchanges have seen the largest hourly net flow of BTC in over three months. The question remains if such a vast amount of coins heading towards platforms could unleash a sell-off and, consequently, a price drop.
Record BTC Net Flow Towards Exchanges
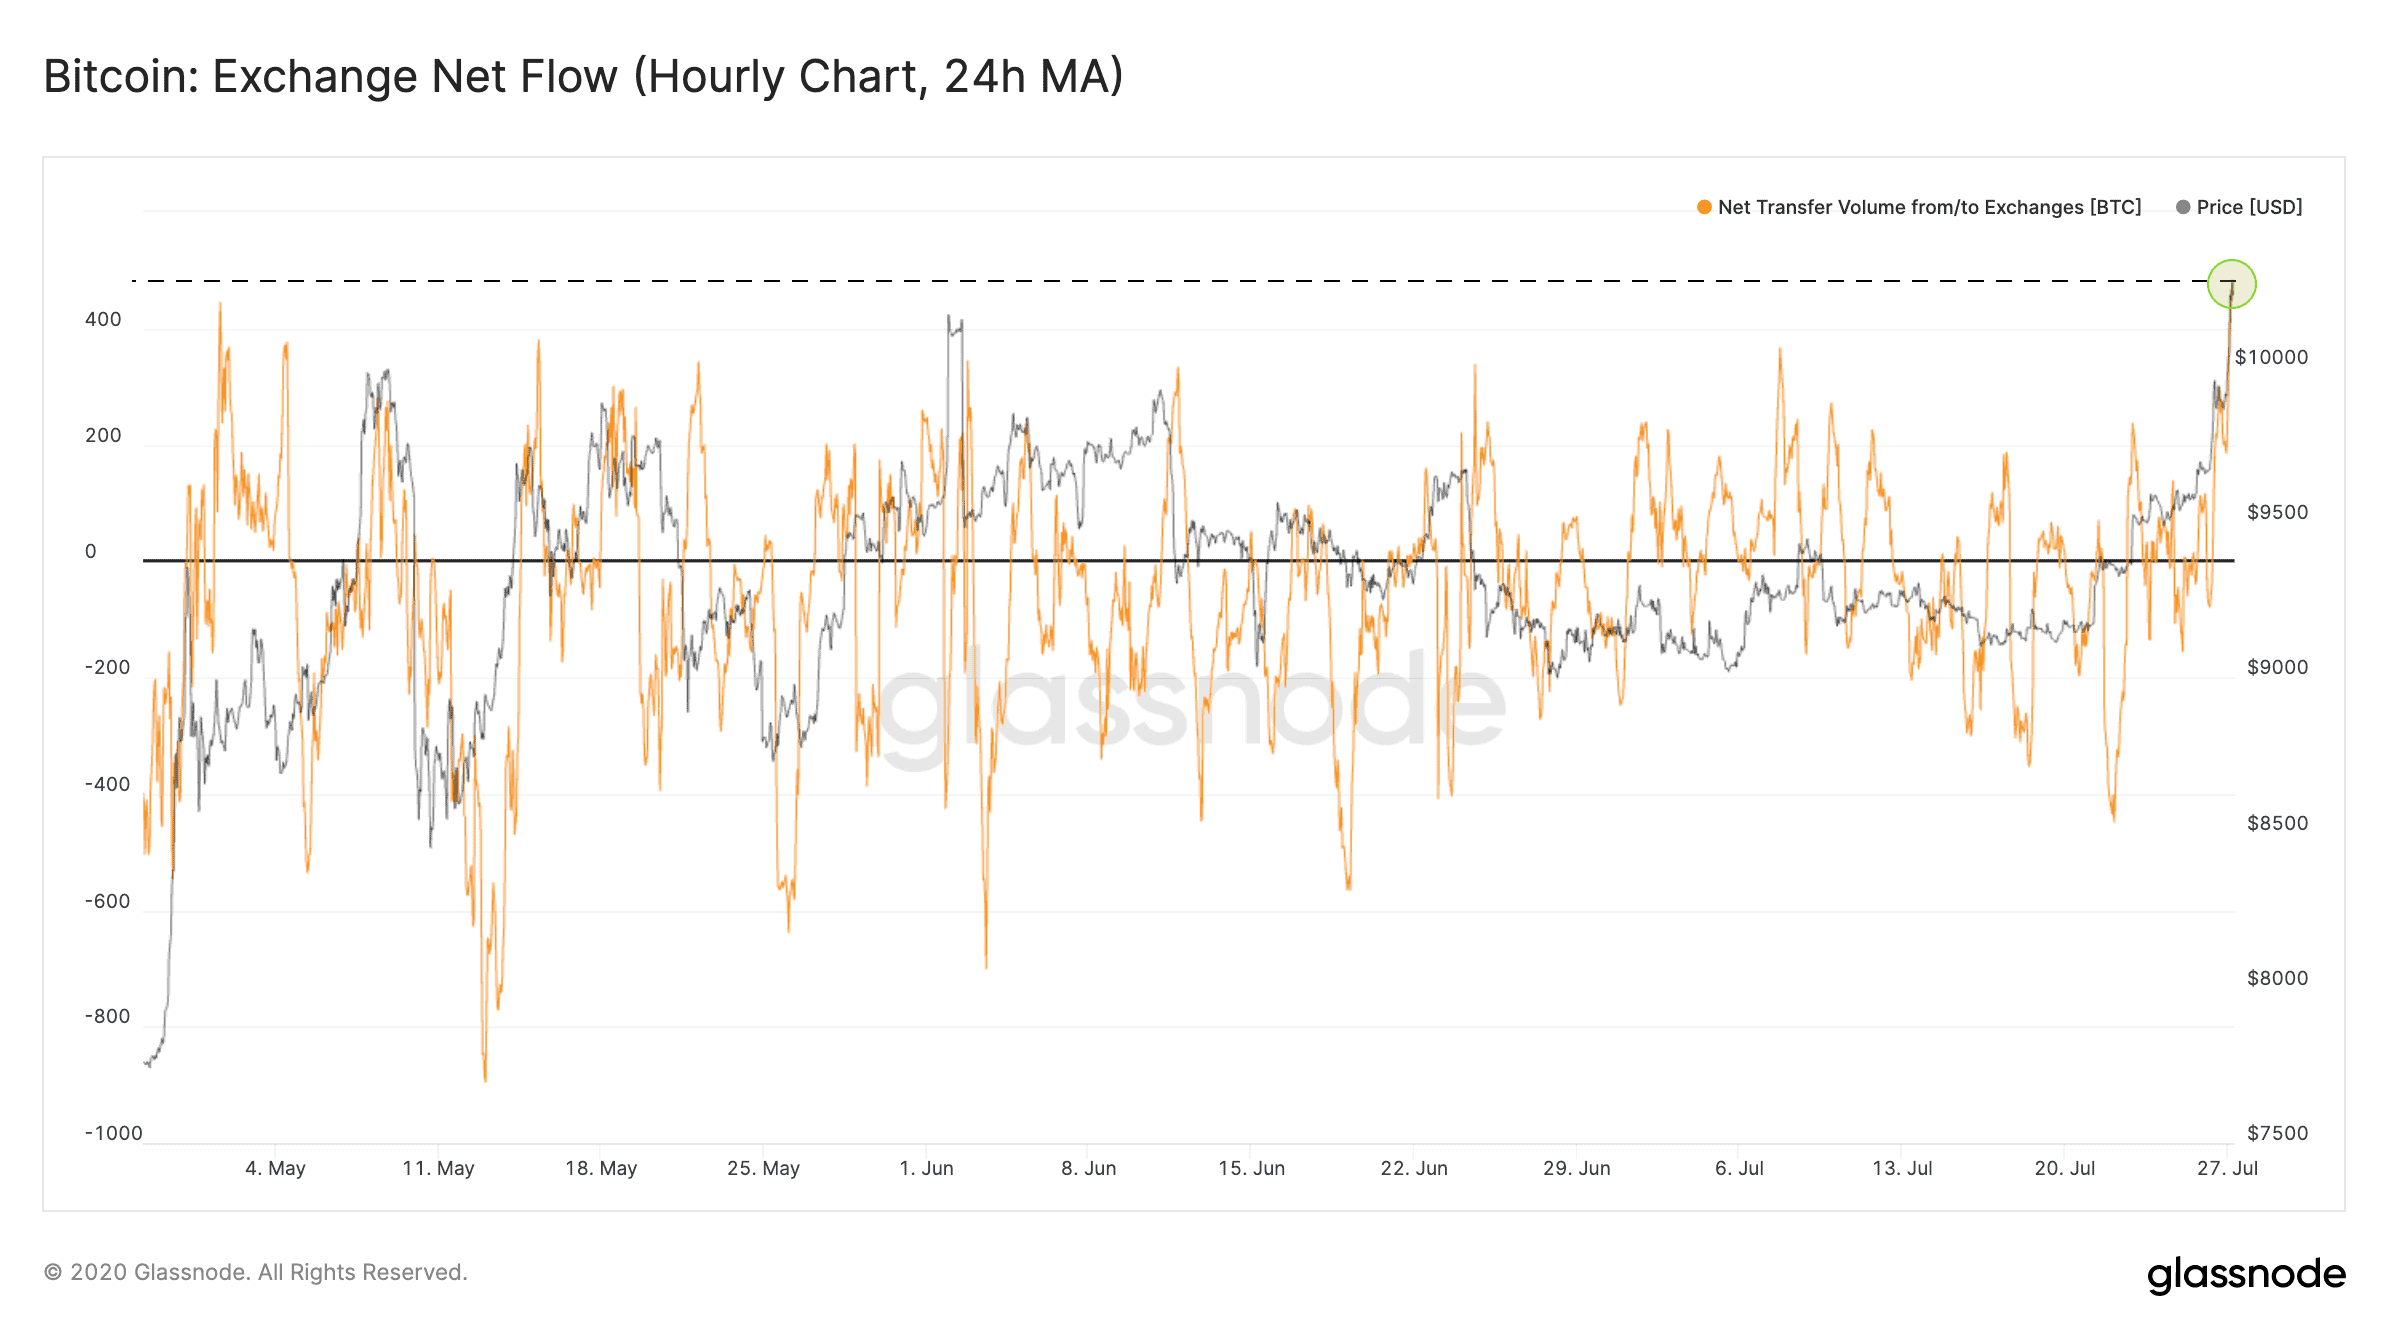
According to data from the monitoring company Glassnode, the net transfer volume from and to centralized exchanges has spiked in the past 24 hours.
It’s worth noting that this “from and to” volume contains transfers initiated from one cryptocurrency platform to another, not only transfers from external addresses. However, the company’s CTO Rafael Schultze-Kraft highlighted that it still represents “a positive net flow.”
Interestingly, the most recent volume transfer increase had surpassed another large one from early May, when Bitcoin was attempting to rise above $10,000 again. Shortly after, though, the price began to tumble and reached $8,100 on some exchange.
Another substantial BTC transfer volume towards exchanges came in early June. Just a few days later, Bitcoin went on another downwards move from a high of $10,000 to $9,000.
Naturally, this brings speculations that these events could prompt similar adverse price developments for Bitcoin. After several unsuccessful attempts and weeks of stagnant movements, the primary cryptocurrency finally managed to conquer the $10,000 price level as reported.
Not So Fast
And while the net transfer volume towards exchanges broke a 3-month record, another indicator suggests that the situation could be somewhat different. The so-called Bitcoin days destroyed (BDD) intends to measure more precisely the real BTC transfer volume.
Its idea is to block a potentially fake noise of high transaction volume. For instance, if a person sends a specific number of bitcoins from one address to another multiple times, he can create the perception of particularly high transaction volume. However, the BDD tracks the coins which haven’t been spent for a while.
It works by multiplying the number of bitcoins in each transaction by the number of days since those coins were last spent. In essence, if someone sends 10 BTC, which weren’t spent in 100 days, would have 10 multiplied by 100 to get the Bitcoin days destroyed number. According to some, this represents a more accurate indication of the BTC network activity.
And, further data from Glassnode revealed that “in contrast to the last two times BTC hit $10,000, we haven’t seen an increase in Bitcoin Days Destroyed.”

Binance Futures 50 USDT FREE Voucher: Use this link to register & get 10% off fees and 50 USDT when trading 500 USDT (limited – first 200 sign-ups & exclusive to CryptoPotato).
Click here to start trading on BitMEX and receive 10% discount on fees for 6 months.
The post appeared first on CryptoPotato


