
Unlike Bitcoin’s stability, the altcoins are celebrating in their own party. Bitcoin dominance recently reached its yearly-low areas after dropping below 62.5% over the past few hours.
Wild Move Upcoming?
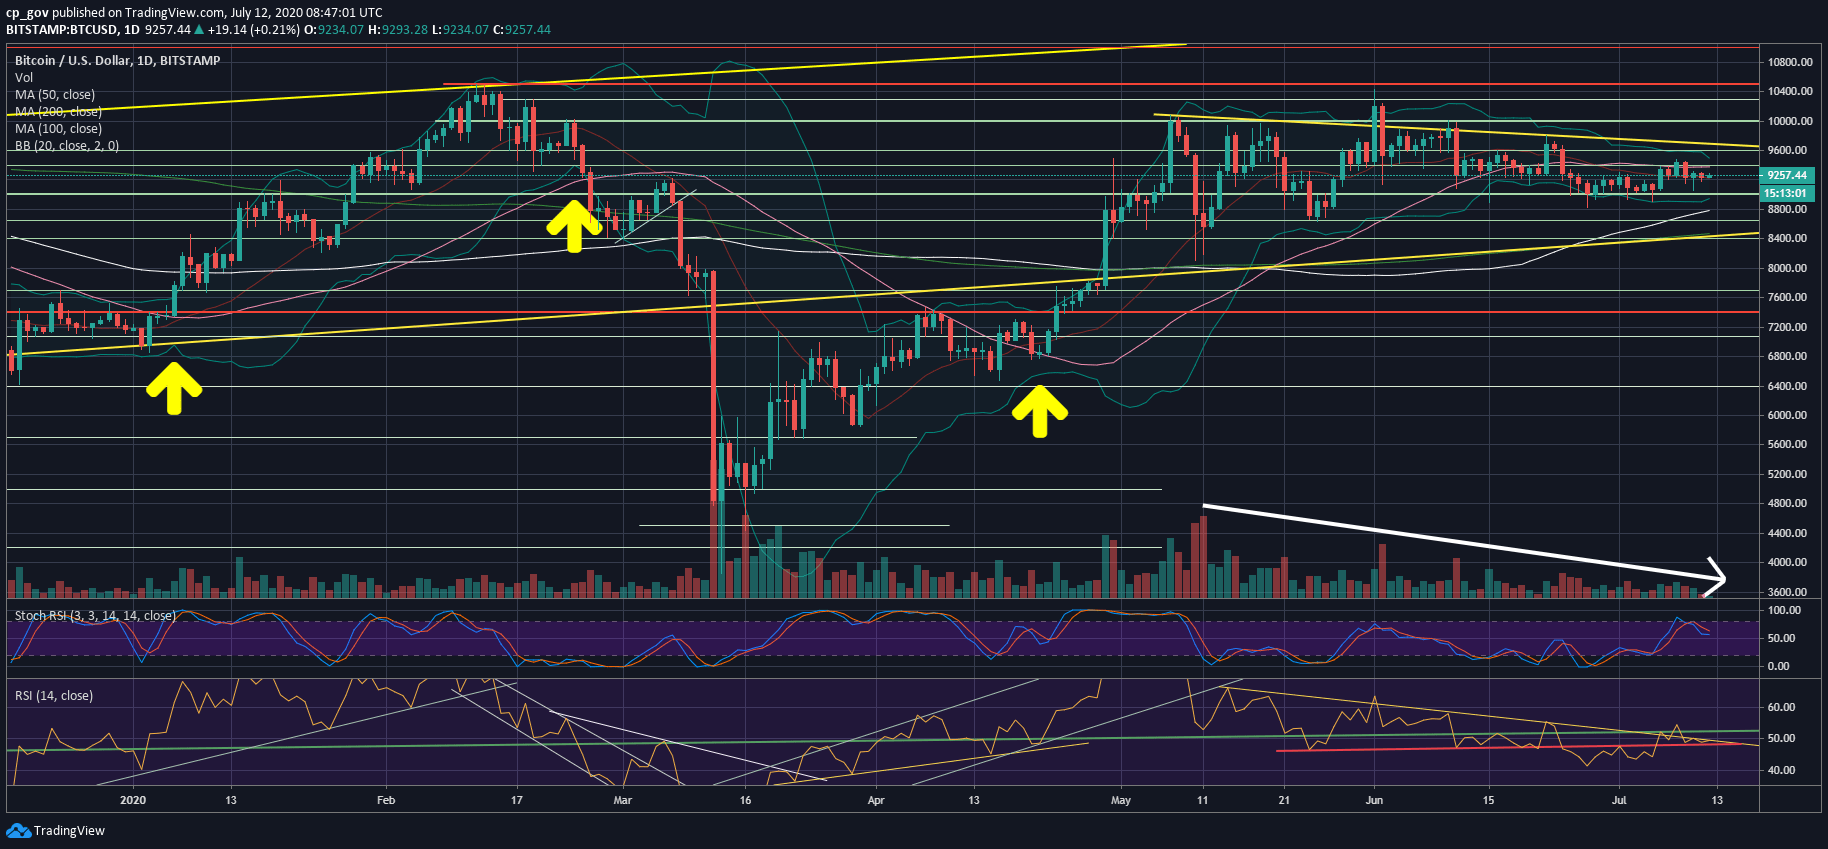
From a technical point of view, Bitcoin’s stability period like this usually ends with a wild move. The indicator we mainly use to measure volatility is the Bollinger Bands.
Those are the three lines following the price action’s candlesticks on the following daily chart. Whenever the upper and lower bands are close to each other, there is likely a huge price move upcoming.
The last occurrences are marked by yellow arrows. As can be seen, since 2020 had begun, three times the bands were tight, although not as tight as today. In two occurrences the following move was to the bullish side, while once it was a bearish one – an unforgettable bearish one – the 50% crash on March 12, 2020.
Besides the BTC price consolidation, we can also point to a declining amount of trading volume. Looking at the same daily chart below, the white arrow on the bottom points on the amount of volume, which is decreasing over time. As been said here before, June ended as the least volatile month for Bitcoin’s price since October 2019. No volatility usually means no trading volume.
In addition, the RSI is also consolidating inside a huge bearish triangle pattern with an apex expected somewhere in the coming week.
Price Levels To Watch In The Short-term
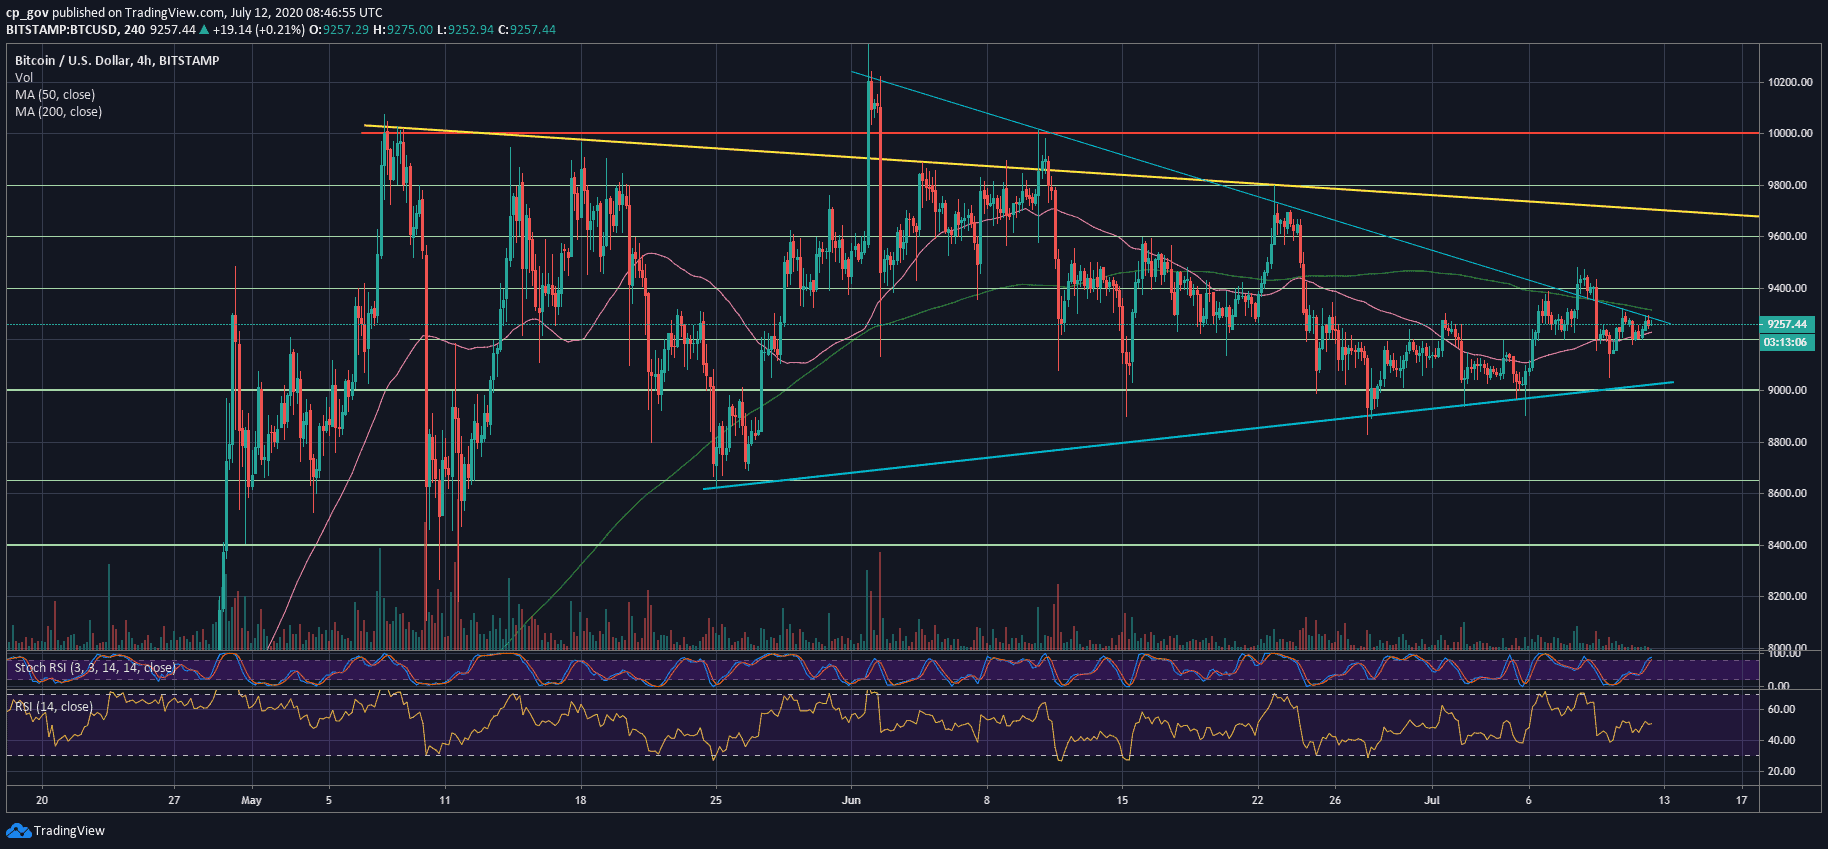
As can be seen on the following 4-hour chart, the critical levels to watch in the short term are $9300 – $9400 (along with the 50-days MA – pink line) from above, and $9000 from below.
In case of a bullish breakout, we would expect the next major resistance to be around $9600, which is the marked yellow descending trend-line on the daily chart. Further above lie the $9800 and $10,000 levels.
From below, in a case $9K breaks down, the next critical level of support is $8800, along with the 100-days moving average line – the white line. Down below lies $8450, which is the 200-days MA (light green line) along with a long-term ascending trend-line.
Total Market Cap: $273.5 billion
Bitcoin Market Cap: $170.7 billion
BTC Dominance Index: 62.4%
*Data by CoinGecko
BTC/USD BitStamp 1-Day Chart
BTC/USD BitStamp 4-Hour Chart
Click here to start trading on BitMEX and receive 10% discount on fees for 6 months.
Disclaimer: Information found on CryptoPotato is those of writers quoted. It does not represent the opinions of CryptoPotato on whether to buy, sell, or hold any investments. You are advised to conduct your own research before making any investment decisions. Use provided information at your own risk. See Disclaimer for more information.
The post appeared first on CryptoPotato


