
The economic situation is starting to feel well the coronavirus effects. As of writing these lines, Crude Oil plunges 30% to a 3-decade low. NASDAQ futures are forecasting another 5% plunge, while London crashes 7%.
What started yesterday as the PlusToken Ponzi’s sell-off, continued today to a massive collapse. The question is whether Bitcoin is a real safe-haven asset, just like Gold? So far, Bitcoin fails the test, following another $1000 plunge since our price analysis from yesterday.
The April 2019 Trend-Line
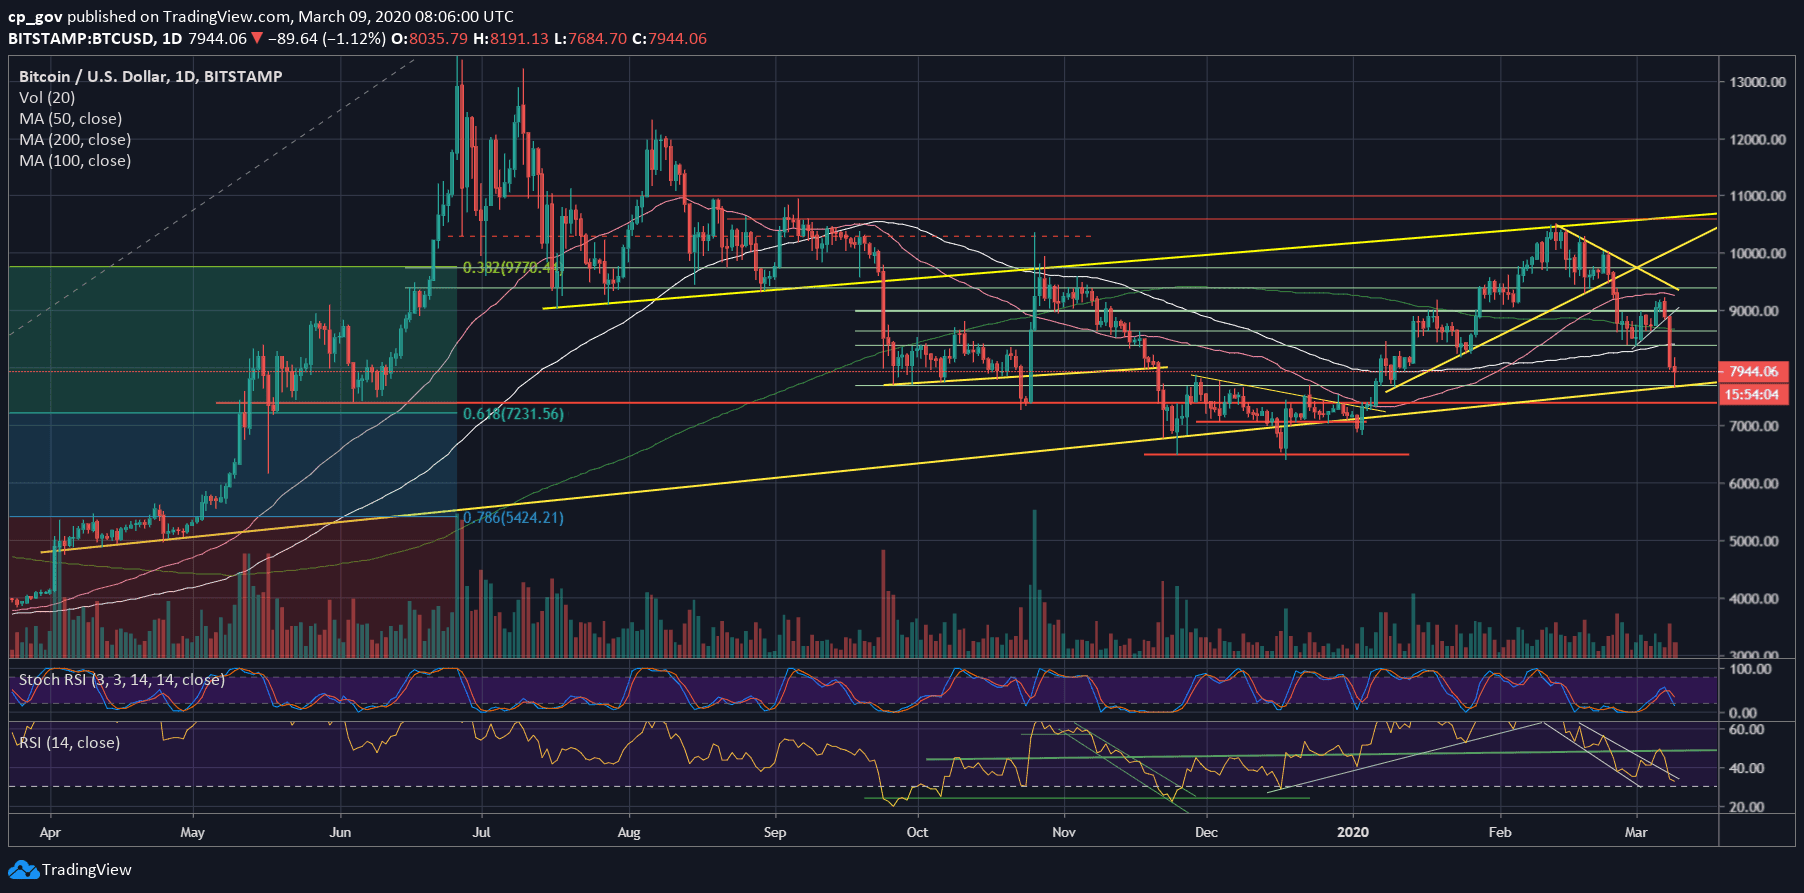
As can be seen on the following daily chart, Bitcoin found temp support at $7600, upon reaching the mid-term ascending trend-line, which started forming in April 2019. $7600 was also an old CME Futures open price gap: well, now it’s finally filled.
From there, Bitcoin quickly corrected to where it’s trading as of writing these lines, around the $7900 level, which is the new support turned resistance level.
As mentioned above, $7600 was a crucial level, being a long-term support. However, keeping in mind the fragile situation around the world, we can expect further volatility to both sides.
In case of Bitcoin breaking down the $7600, and we are likely to see a quick retest of the next support at $7400 (weak) and then $7200, which is the Golden Fibonacci retracement level from the 2019 June Bull-Run.
Below lies and $7000 and $6800, which is the 2020 low from January 3rd. Further below lies $6400 – $6500, which is the double bottom from November – December of 2019.
Total Market Cap: $227 billion
Bitcoin Market Cap: $145 billion
BTC Dominance Index: 63.6%
*Data by CoinGecko
Key Levels To Watch & Next Possible Targets
– Support/Resistance levels: The possible targets from below are stated above. In case of a correction, then the first level of resistance is the current level at $7900 – $8000. This is followed by the support line that was broken yesterday at $8300. Further above is $8500.
– The RSI Indicator: The RSI broke down violently, just like the price. As of writing these lines, the indicator is almost touching its low from December 2019. As stated here yesterday: “The fact that the RSI couldn’t get over 50 is a red flag for the Bulls.”
– Trading volume: As expected, yesterday’s volume level was the second-highest volume day year-to-date. The bears are here.
BTC/USD BitStamp 4-Hour Chart

BTC/USD BitStamp 1-Day Chart
The post Bitcoin Price Analysis: After $1600 Plunge In 48 Hours, Those Are The Next Possible Targets For BTC appeared first on CryptoPotato.
The post appeared first on CryptoPotato


