
On our latest price analysis from yesterday, we stated that the Bitcoin price is about to make its next major move. A few hours later, and the anticipated move played out.
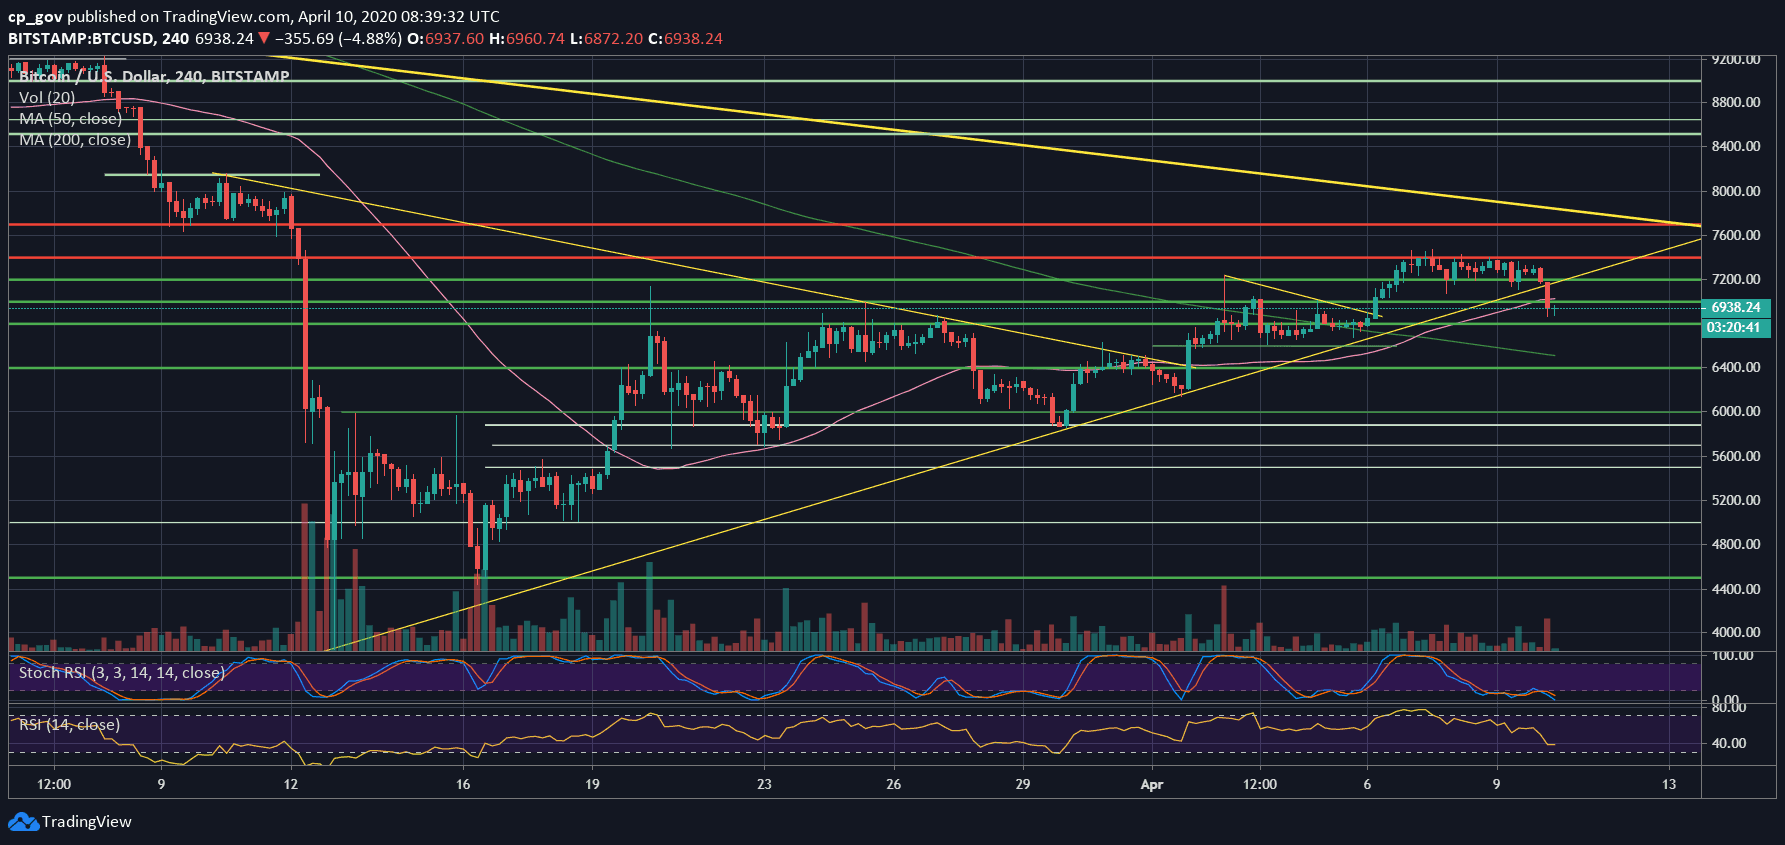
Unfortunately to the bulls, Bitcoin broke down the 3-day stability between the range of $7200 – $7400. As of writing these lines, the primary cryptocurrency is trading below $7000, recording its current daily low roughly above $6850.
Over the past days, Bitcoin couldn’t break above the pink line below, which is the 50-days moving average line (now lies around $7300).
3 Days Of Uncertainty Incoming
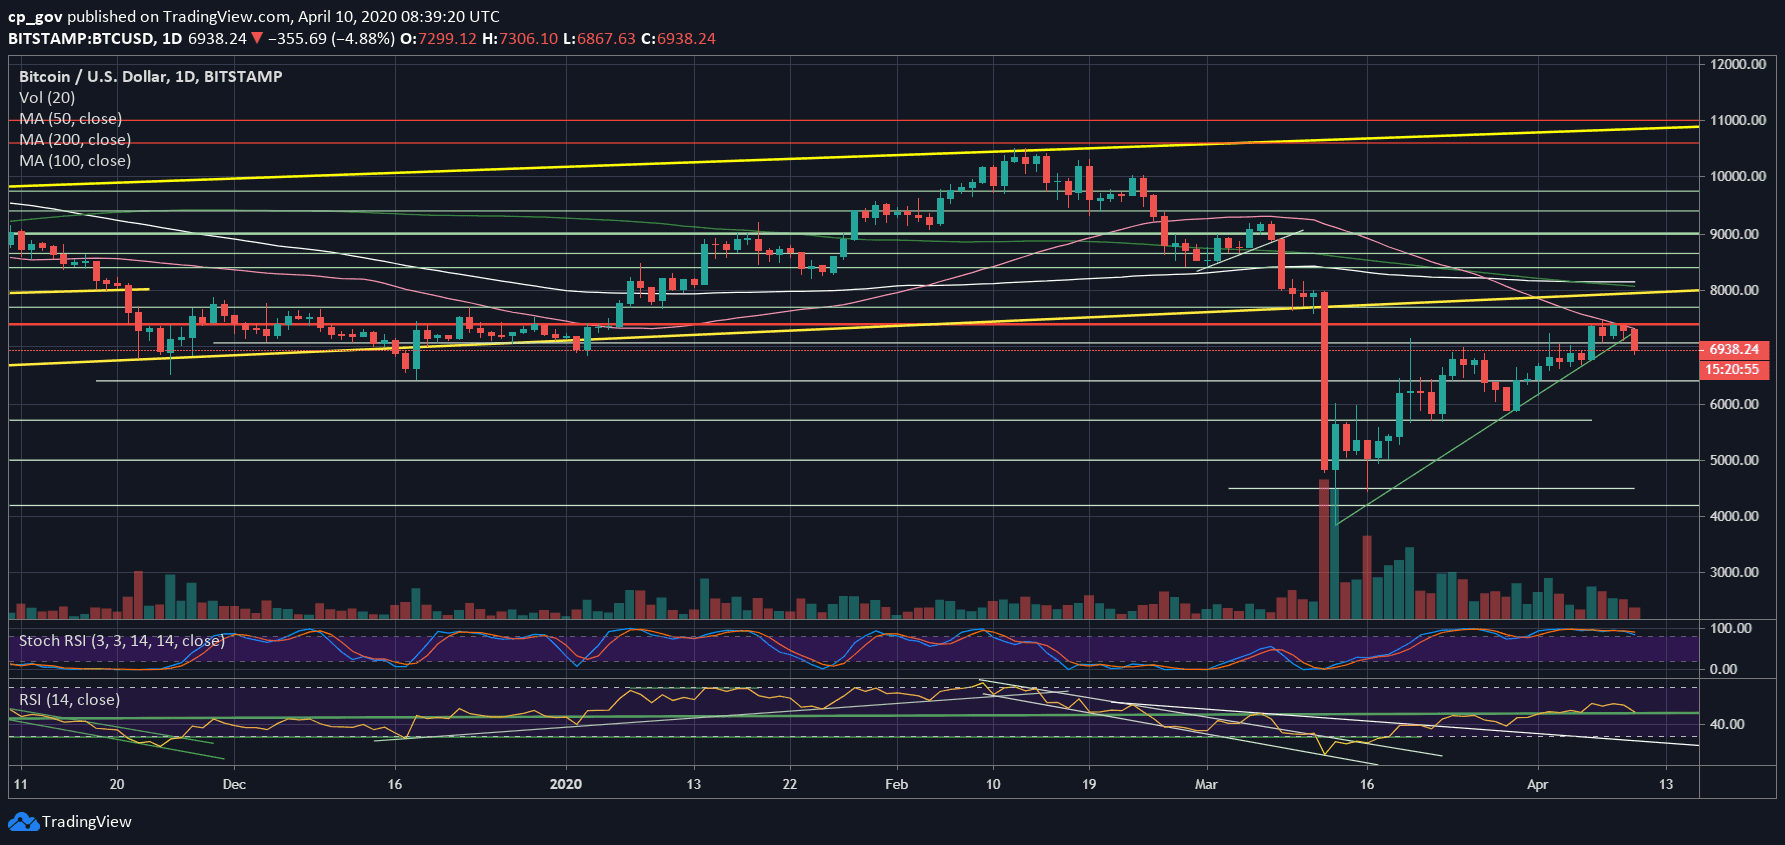
Since this COVID-19 crisis started, somewhere at the end of February, both Bitcoin and Wall Street major indices had plummeted 40%. Somewhere around mid-March, there was a turning point, where Wall Street started to correct, and guess what? Bitcoin followed.
The positive correlation, which is not what Bitcoin was born for, sent both Bitcoin and S&P 500 20-25% in the green. We see this back-to-back correlation, especially over the past few days.
Today is going to be Good Friday, and Wall Street will be closed. This incoming long weekend will mean Bitcoin will have to move on its own for the next three days (until Monday morning US time).
It will be interesting to see how Bitcoin will act. However, the technical signs are not in favor of Bitcoin. As we mentioned here yesterday, the RSI was starting to show some bearishness following negative divergence.
Besides, on the 4-hour chart, we can clearly see the breakdown of the ascending trend-line started forming since March 12. A daily close above $7200 is crucial for bulls in the short-term.
One thing for sure: Due to extreme volatility, the momentum is changing these days very quickly. Extra-caution is needed.
Total Market Cap: $198 billion
Bitcoin Market Cap: $127.3 billion
BTC Dominance Index: 64.3%
*Data by CoinGecko
Key Levels To Watch & Next Possible Targets
– Support/Resistance levels: Following the breakdown, Bitcoin is now facing $7000 as the initial support turned resistance level. As mentioned above, a daily close above $7200 is critical. Further above lies the monthly high around $7400 – $7500. However, the momentum is with the bears, until proven elsewhere.
From below, the first area of support is today’s low around $6800 – $6850. Down below lies $6600, before the $6450 level.
– The RSI Indicator: The RSI found support exactly above the 50 level. This might be a turning point. A breakdown here, and we can expect the price to reach the lower mentioned support levels.
– Trading volume: It seems like the volume candle is going to be the highest over the past days, which is not a perfect sign for the bulls. There is still a long-time until today’s candle closes.
BTC/USD BitStamp 4-Hour Chart
BTC/USD BitStamp 1-Day Chart
The post Bitcoin Price Analysis: After Breaking Down 30-Day Trend-Line, Can BTC Resist Or Will It Plunge To $6K? appeared first on CryptoPotato.
The post appeared first on CryptoPotato


 Price Could Return to $74K Highs: QCP Capital")
 Price Soared Past $160")