
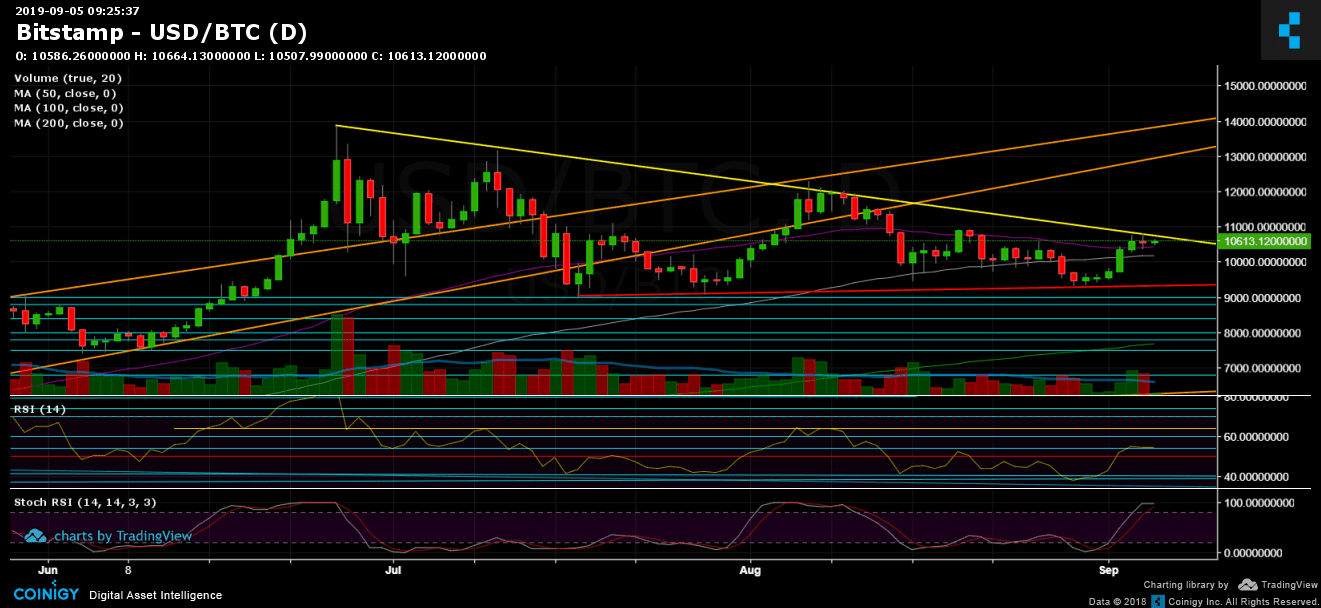
Since our previous analysis, Bitcoin had succeeded in breaking up the 50-days moving average zone, straight into our next mentioned support area at $10,800, along with the crucial descending trend-line (marked with yellow on the following daily chart).
From there, we saw Bitcoin taking a break to recalculate its next destination: Whether it’s finally going to break up the tend-line started forming at the end of June, when Bitcoin reached the 2019 high of $13,880, or whether this line will produce another roof for the cryptocurrency’s price.
This is the bigger picture, and the chances are equal in my opinion. Some indicators are pointing up while some other – down. What is for sure is since the Bitcoin dominance had broken above 70% (for the first time since March 2017), the altcoins seem more like a falling-knife than projects competing with Bitcoin.
Total Market Cap: $268 billion
Bitcoin Market Cap: $190 billion
BTC Dominance Index: 70.8%
*Data by CoinGecko
Key Levels to Watch
– Support/Resistance:
From the supporting side: The levels of $10,300 – $10,500 had turned into a strong support area. That level contains the 50-days moving average linen. Further below is $10,000 – $10,100 (100-days moving average line), $9700 – $9,800 before reaching the weekly low areas at $9,400 – $9,500.
From above, the major resistance is the $10,800 – $11,000 resistance area, along with the above mentioned yellow descending trend-line. Further above is $11,500 – $11,600 resistance, before reaching the $12,000 zone. However, the $11,000 region is expected to be tough for Bitcoin. That level is the latest high on the daily chart. If Bitcoin wants to continue the parabolic run, it must create a higher high above $11,000.
– Daily chart’s RSI: Here again, Bitcoin had encountered resistance area (54-55 levels). After the healthy move from the lowest zones (since February) at 40, the RSI had surged above, back to the bullish area, where it is currently trading and facing resistance. Another thing to note is that the stochastic RSI oscillator is about to make a cross-over at the overbought territory. It this plays out – we can expect a bearish correction for the next days.
– Trading Volume: Despite the nice gains of the past days, the volume hadn’t been showing up yet. If the bulls want to prove they are back, they would need to bring up a higher number of buyers.
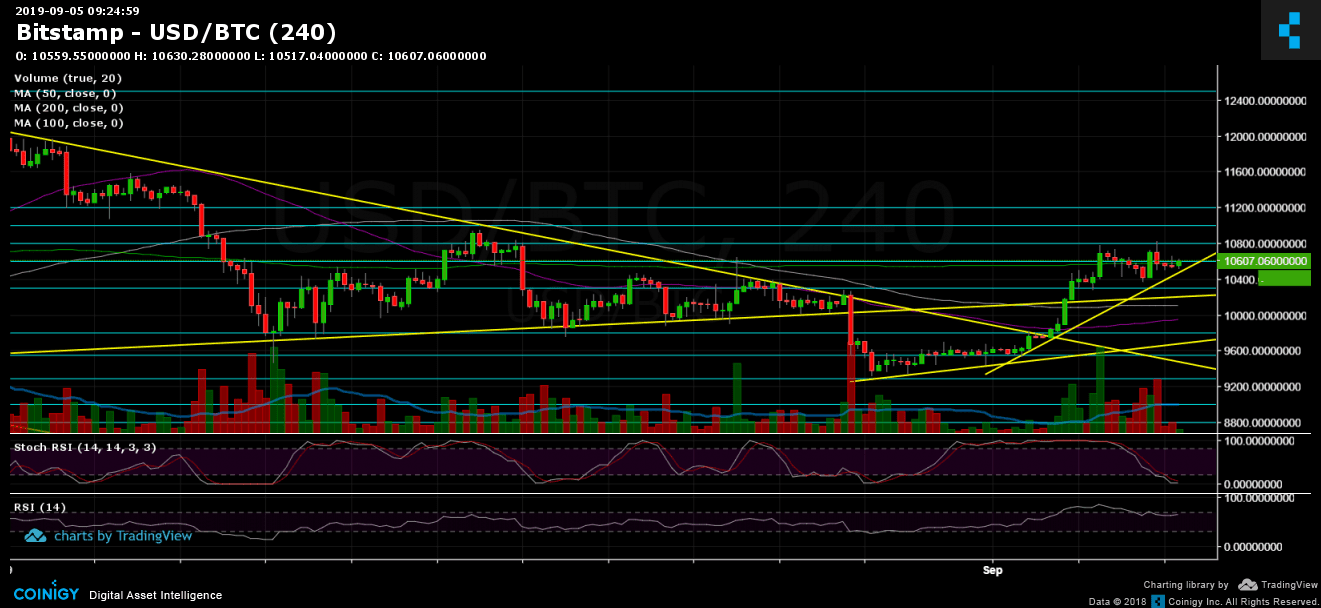
BTC/USD BitStamp 4-Hour Chart
BTC/USD BitStamp 1-Day Chart
More news for you:


The post appeared first on CryptoPotato


