
- Bitcoin is currently down by 1.5% after a surging to $10,000 mark on Thursday, but a rebound could be underway.
- The primary cryptocurrency is looking for a substantial rebound level around $9,400
Key Resistance Levels: $9,800, $10,000, $10,475, $10,970
Key Support Levels: $9,450, $9,100, $9,000, $8,500
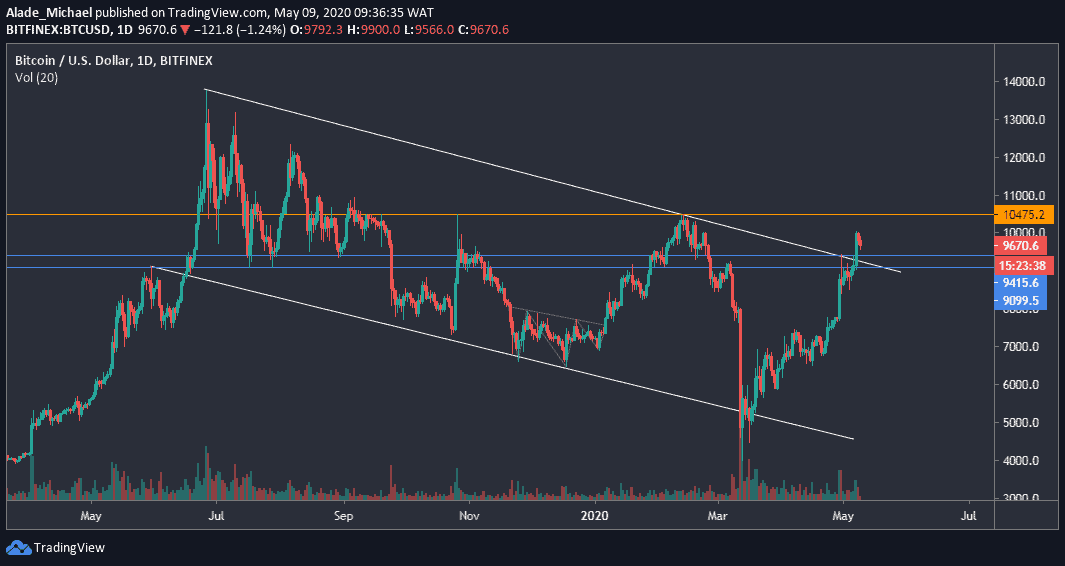
BTC/USD 1D. Source: TradingViewBitcoin’s recovery from the March crash (to $3800) is quite notable, and it’s safe to say that the bulls are technically back in the market. The fundamental part of it is the halving event, which is estimated to take place in three days.
After last week’s surge from $7700 to $9000, Bitcoin’s price continued to increase significantly to reach a key level of $10000 a couple of days ago. Due to the high buying volume, BTC dominance quickly increased above 67% for a couple of days now, causing a lot of troubles for the altcoins.
The major technical aspect is that Bitcoin made a long-term bullish move after breaking from a 12-month descending channel (a bull flag pattern) as presented on the daily chart.
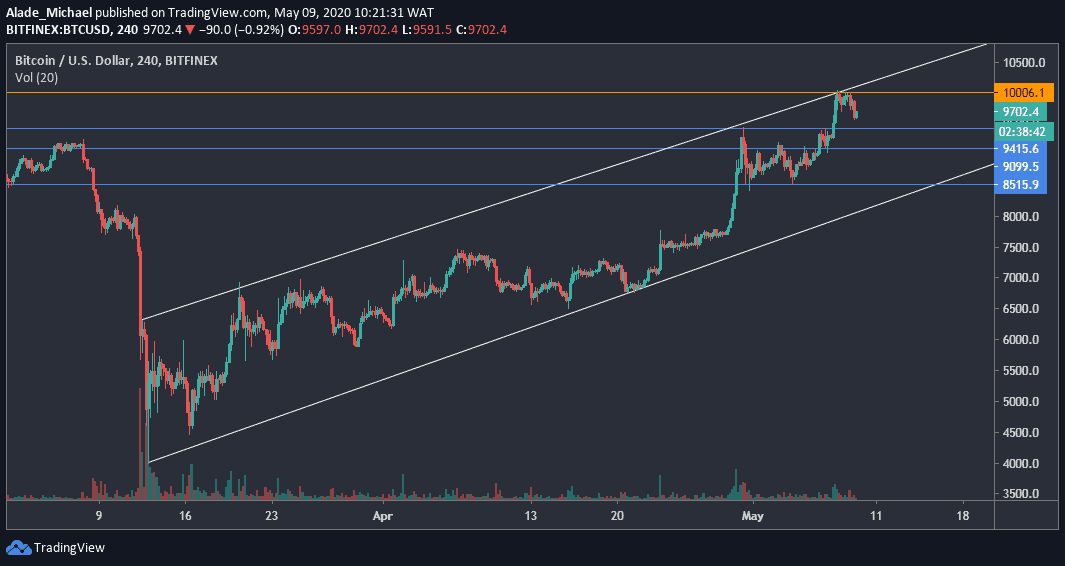
On the 4-hours chart, Bitcoin maintains a parabolic move inside a channel, although the price is now correcting downward after touching the channel’s resistance at $10,000, hinting that perhaps it’s not yet ready to overtake it.
As of now, Bitcoin is pulling back to providing buyers with another opportunity/discount. At the same time, Bitcoin is looking for a support level to activate a new increase. Once Bitcoin manages to pin support above the $9,000 price zone, intense buying pressure should be expected.
Bitcoin Price Analysis
The pullback level to watch is $9,400 and $9,100, marked blue on the daily chart. Bitcoin may even retest $9000 (last week’s high) if volume decreases. A breakdown could slip BTC to the channel’s support at $8500 on the 4-hours chart.
Should Bitcoin regain momentum now, it would first need to climb back to the $9,800 and $10,000 resistance levels before breaking out to reclaim the February resistance at $10,450 – which is currently holding as yearly high.
The next buying target will be $10,970 (around the channel’s upper boundary) if BTC continues to advance higher. But as of now, the price is trading at around the $9,670 mark against the US Dollar following a 2-day correction.
Intense bearish action should be accounted for if Bitcoin drops off this short-term ascending channel. Considering the bull flag breakout on the daily chart, more gains should be expected once Bitcoin starts to recover.
The post Bitcoin Price Analysis: BTC Facing Trouble Breaking The $10K, Worrying Sign Before Halving? appeared first on CryptoPotato.
The post appeared first on CryptoPotato


