
Over the past two days, Bitcoin topped at a high around the $7300 mark, with no success of reaching the monthly high at $7400 – $7500.
This resulted in a lower high, that terminated the higher-highs bullish trajectory which had been developed since the plunge below $4000 on March 12.
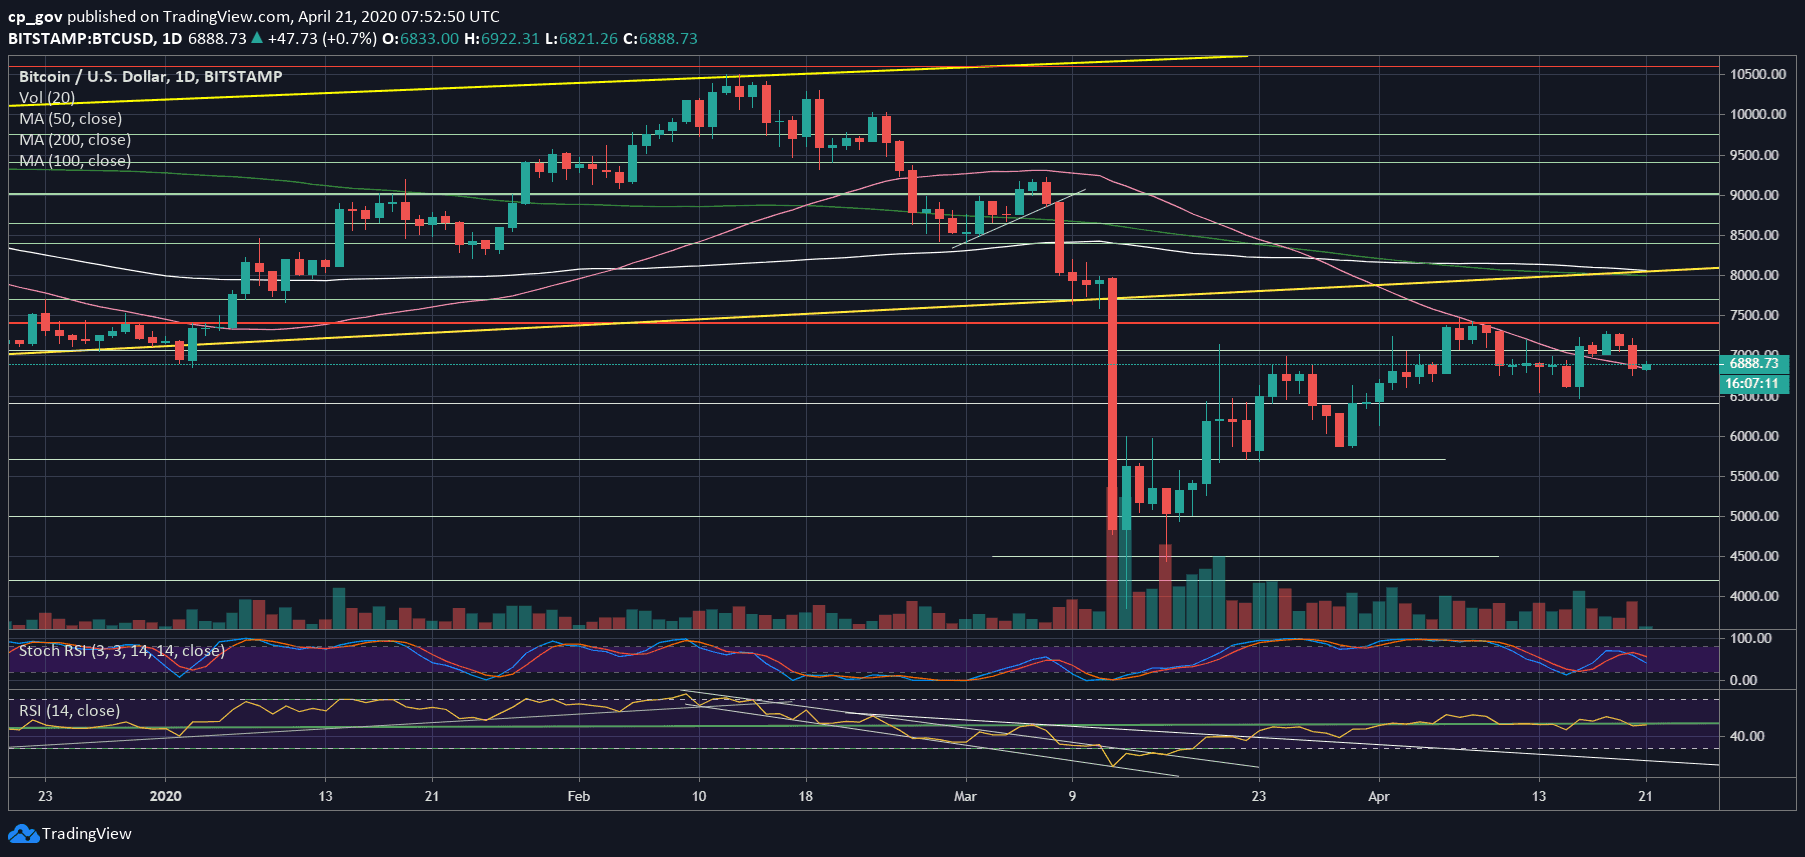
Bitcoin had completed a 2-day price drop of $500: from Sunday’s high around $7300 to yesterday’s low at $6757 (Bitstamp). As we can see on the following daily chart, Bitcoin found support upon the 50-days moving average line (marked pink), which currently lies around $6800.
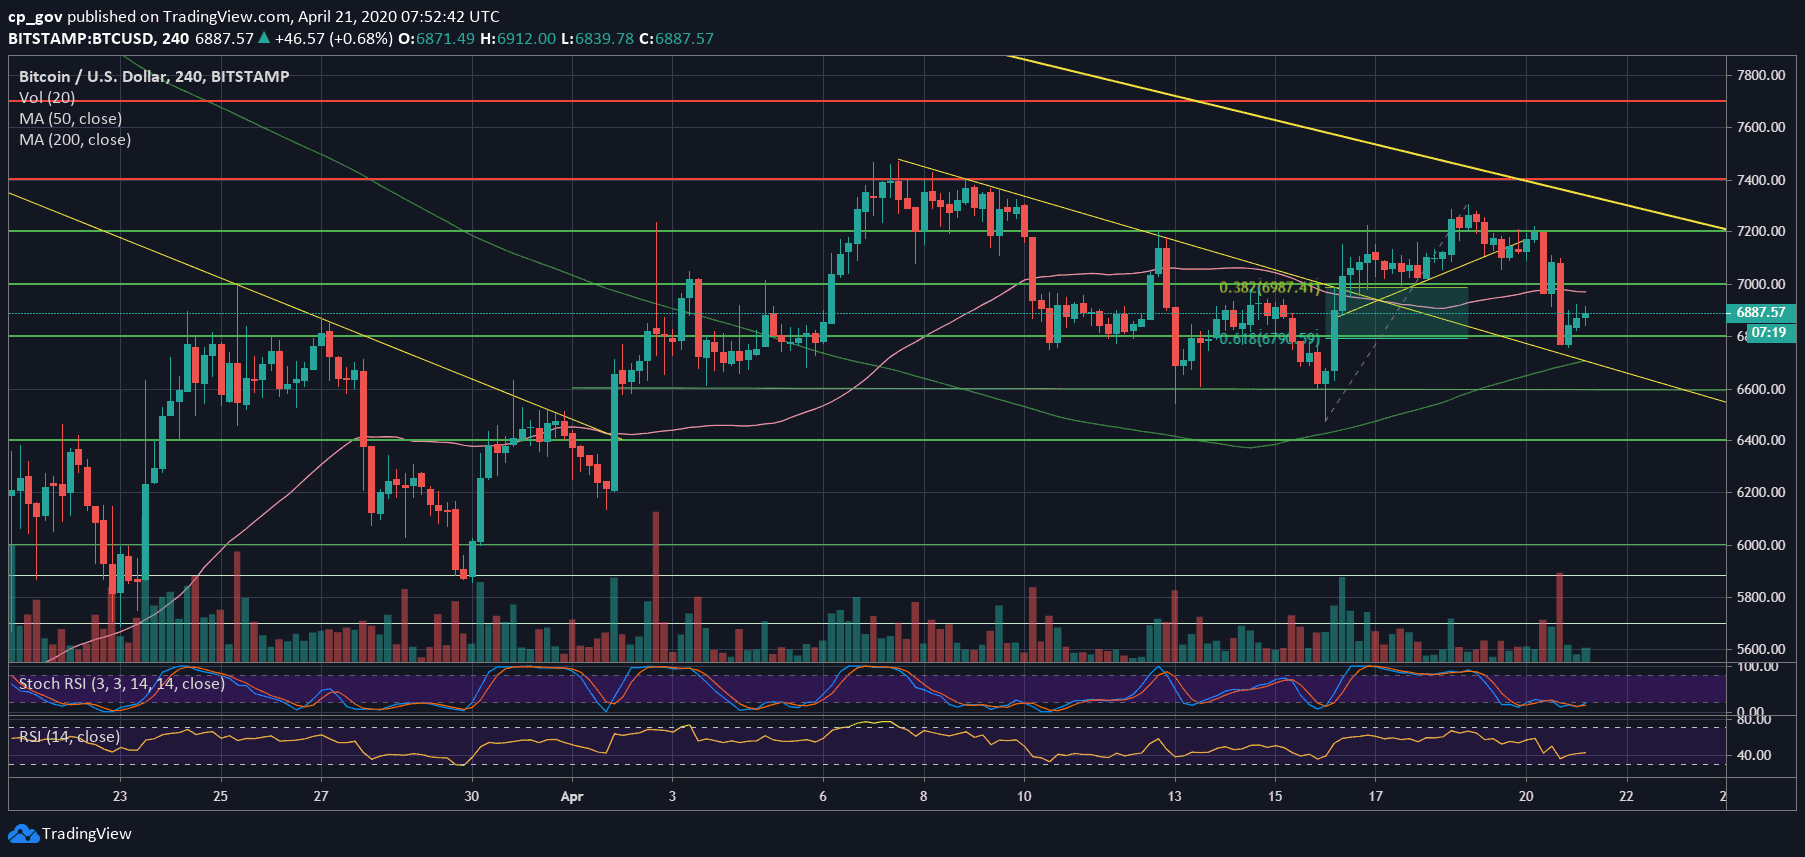
This is also the Golden Fib level (61.8%), as can be seen on the following 4-hour chart.
The RSI is also back to the indecisive/fragile territory, around the 50-level. As can be reflected by the price, the RSI, which is also known as the momentum indicator, also went through a lower high.
The Oil Effect
Yesterday the global markets crashed 2%, on average, following the odd situation with the oil prices. The latter plunged below zero because the world ran out of storage space and, of course, minimal consumption due to the COVID-19 novel virus.
As we noticed, Bitcoin is having a high correlation to the global markets since the crisis had begun. Hence, we can expect the volatility form yesterday to continue today as well.
Total Market Cap: $199.5 billion
Bitcoin Market Cap: $126.7 billion
BTC Dominance Index: 63.6%
*Data by CoinGecko
Key Levels To Watch & Next Possible Targets
– Support/Resistance levels: After getting rejected, Bitcoin is now facing $6800, along with the mentioned MA-50 line, as the first level of support. In case the level breaks down, then the $6700 might support the price, before the $6600 support area. Further below lies $6300 – $6400.
From above, the first level of resistance is around $7000, where lies the Fib level of 38.2%. Further above lies the local high from the weekend at $7200 – $7300 and the marked descending trend-line, followed by April’s high at $7400 -$7500.
– The RSI Indicator: Discussed above.
– Trading volume: Despite the drop, the volume was not significant compared to the monthly average, and continues the daily volume drop since the peak of March 12 and 13.
BTC/USD BitStamp 4-Hour Chart
BTC/USD BitStamp 1-Day Chart
The post Bitcoin Price Analysis: BTC Finds Support Upon The MA-50, But The Global Oil Crisis Danger Is Imminent appeared first on CryptoPotato.
The post appeared first on CryptoPotato


