
Since our previous price analysis two days ago, we saw Bitcoin trading under a tight range between $8500 from below and $8700 from above – which is the 200-days moving average line.
As been mentioned in our recent price analysis, the $8500 is considered a critical support area. So far, this support holds nicely over the past three days, whereas the next few hours are likely to decide the upcoming move of Bitcoin’s price. The declining amount of trading volume also supports this thesis.
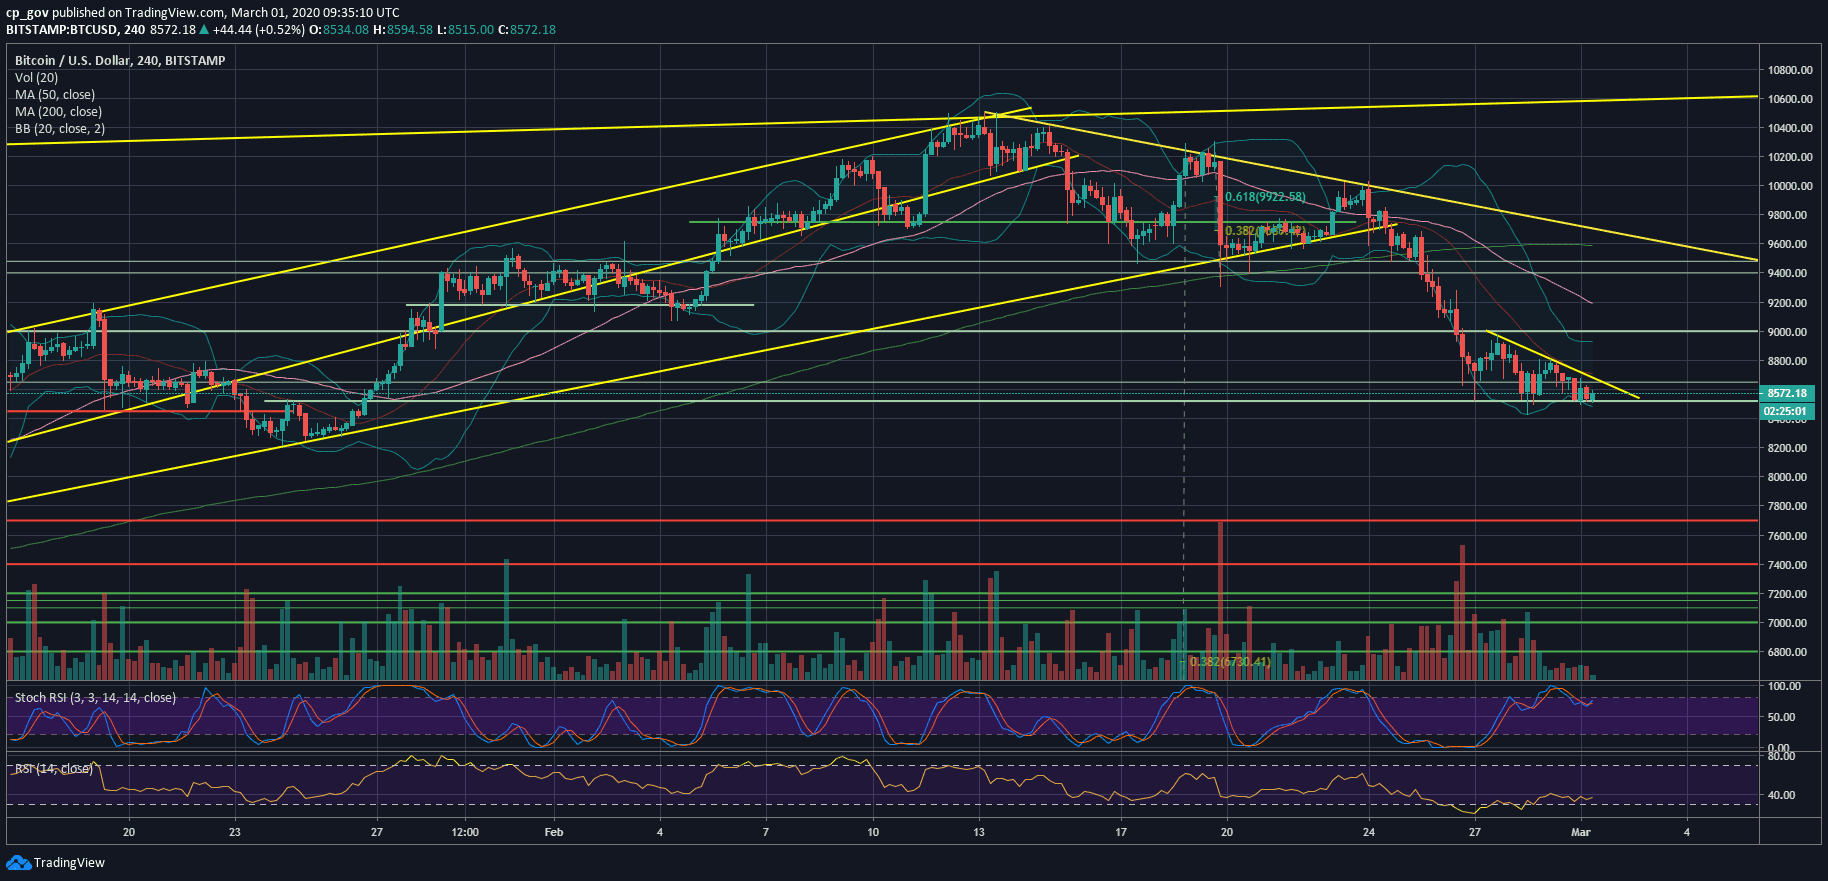
Despite the above, the short-term is still bearish for Bitcoin, and the primary cryptocurrency will try to avoid completing a bearish triangle pattern as marked on the following 4-hour chart.
In case the triangle breaks down, then we can expect a price target of $8200, which is the next significant support area, before a revisit of the $8000 benchmark level, which is the 61.8% Fibonacci retracement level of the recent bullish move to $10,500 (mid-February).
In between, lies the 100-days moving average supporting line, currently around $8300.
Total Market Cap: $244.7 billion (in four days almost $50 billion evaporated)
Bitcoin Market Cap: $156.3 billion
BTC Dominance Index: 63.8%
*Data by CoinGecko
Key Levels To Watch & Next Possible Targets
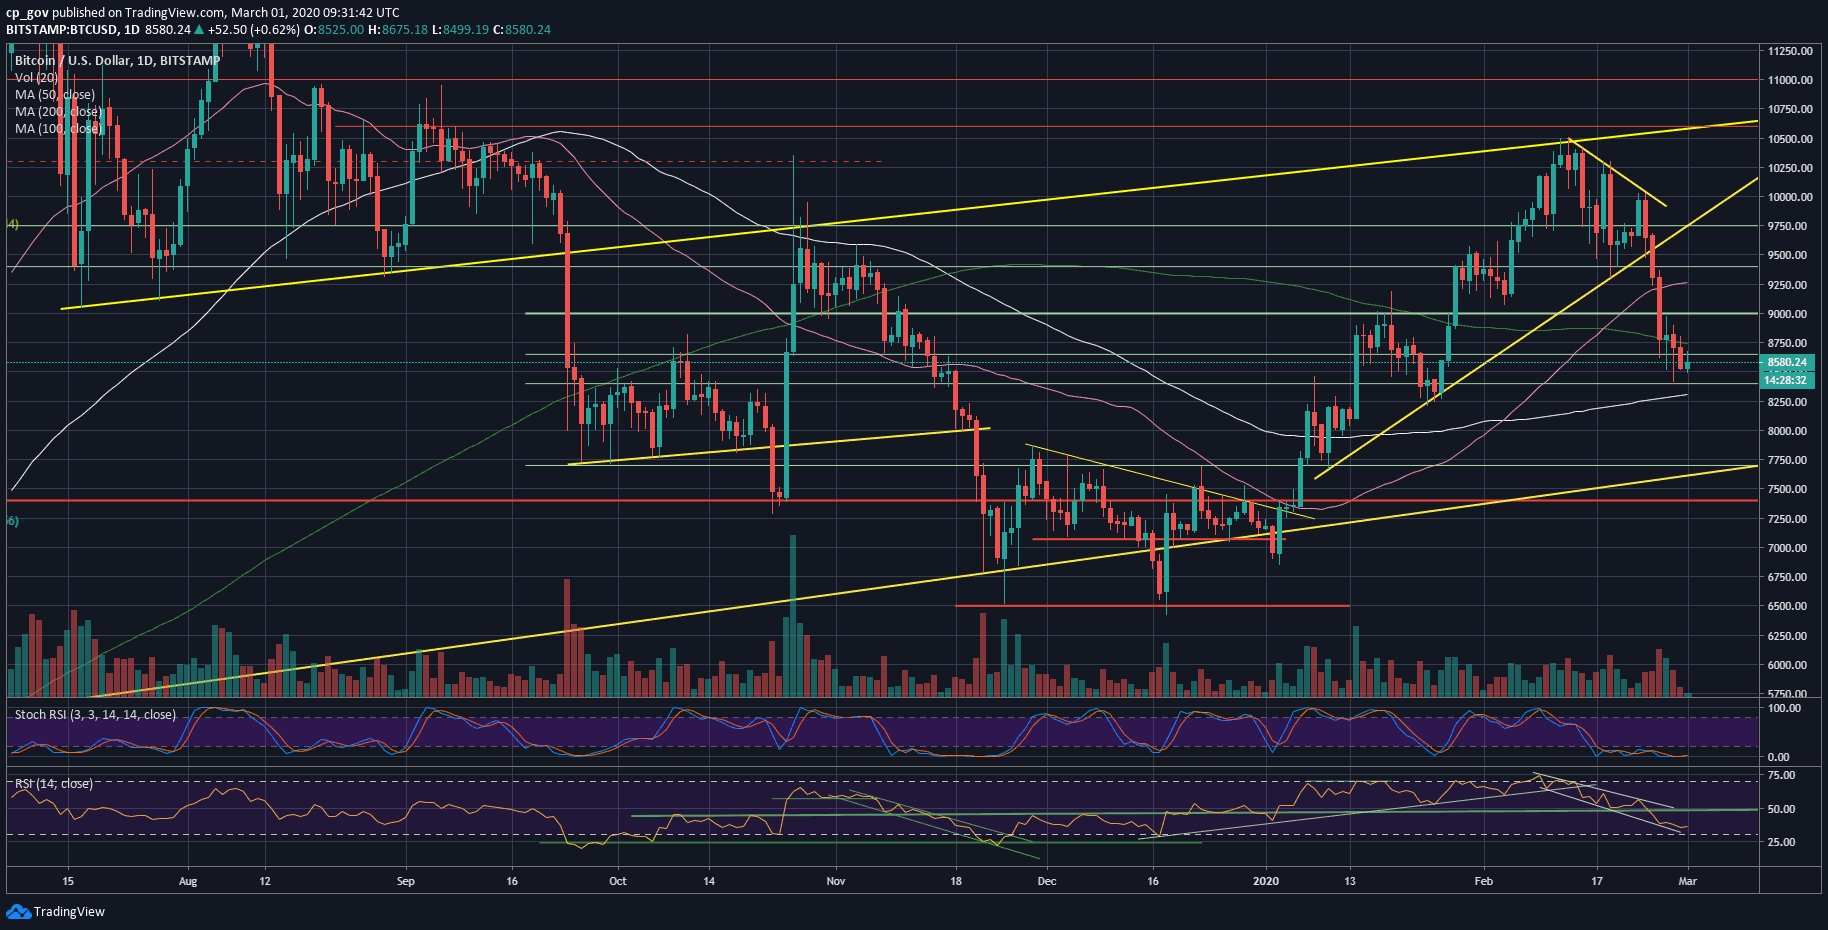
– Support/Resistance levels: From below – levels discussed above. From the bullish side, in case that Bitcoin maintains the $8400 – $8500 support level, then the first level of resistance would be $8800 (the MA-200 lies at $8750), followed by $9000. Further above lies $9250, which is also the 50-days moving average line (marked pink).
– The RSI Indicator: As been said in the previous analysis and despite a slight recovery, the daily RSI indicator is currently at its lowest levels since November 2019 (when Bitcoin was trading for $6400).
The stochastic RSI oscillator is also at its low oversold levels, however, still far from making a bullish crossover.
– Trading volume: Since Wednesday, the trading volume correlates with the price action. The volume candles are declining; this might forecast a huge move coming up probably in the next day or two.
BTC/USD BitStamp 4-Hour Chart
BTC/USD BitStamp 1-Day Chart
The post Bitcoin Price Analysis: BTC Still Holds Critical Support, But Huge Price Move To $8200 Or $8800 Is Imminent appeared first on CryptoPotato.
The post appeared first on CryptoPotato


