
Just five days ago, Bitcoin was trading for more than $10,000 per coin. As the coronavirus fears hit the stock markets, Bitcoin is not left behind.
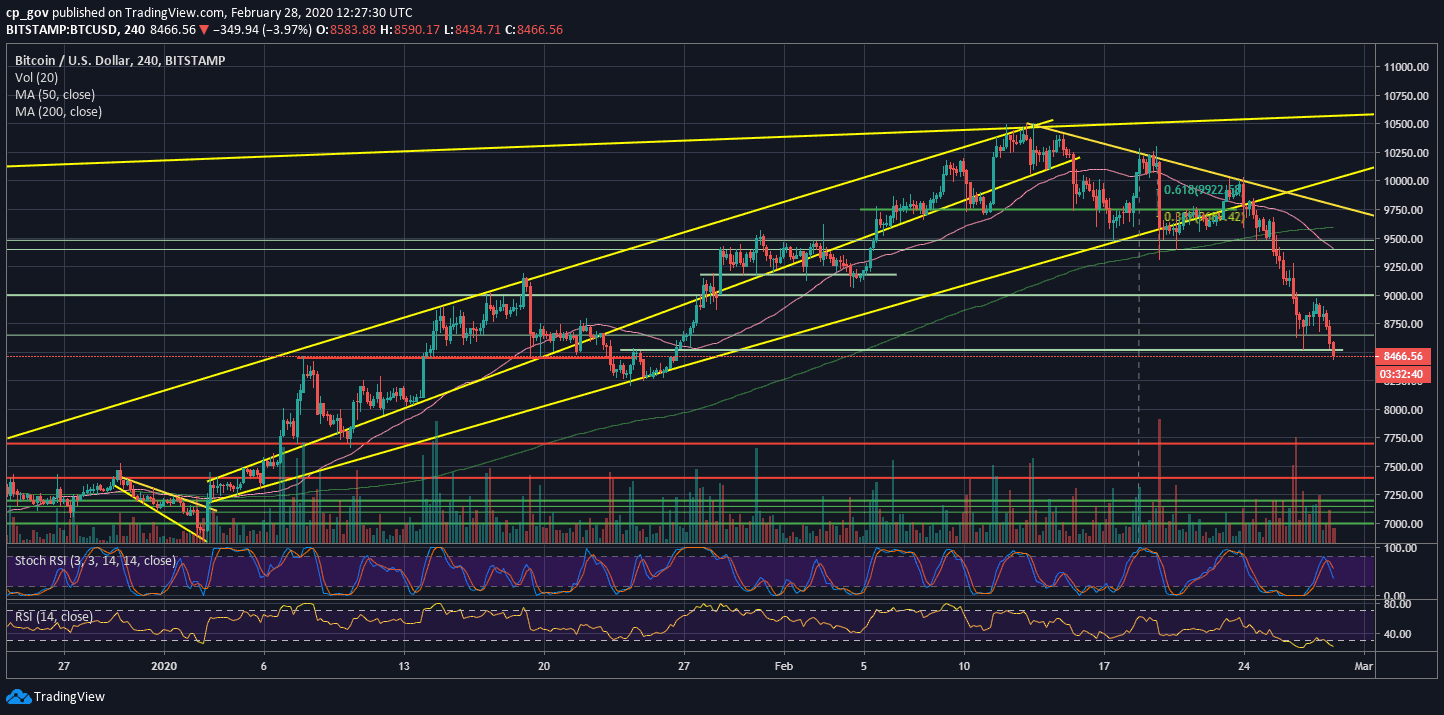
The coin had completed $1000 drop in just three days, and over the past two days, Bitcoin had continued its decline towards the $8400 – $8500 horizontal support. The latter was mentioned here on the previous BTC price analysis from two days ago.
Looking at the daily timeframe, we can see that Bitcoin was testing the $8770 – $8800 zone for the past days, despite a flash drop to $8520 (on Bitstamp).
The $8800 support turned resistance contains the significant 200-days moving average line (marked light green on the following chart). So far, the daily candles of Wednesday and Thursday closed above the MA-200 line. However, today is very likely to be the first daily close below the line since January 27, 2020.
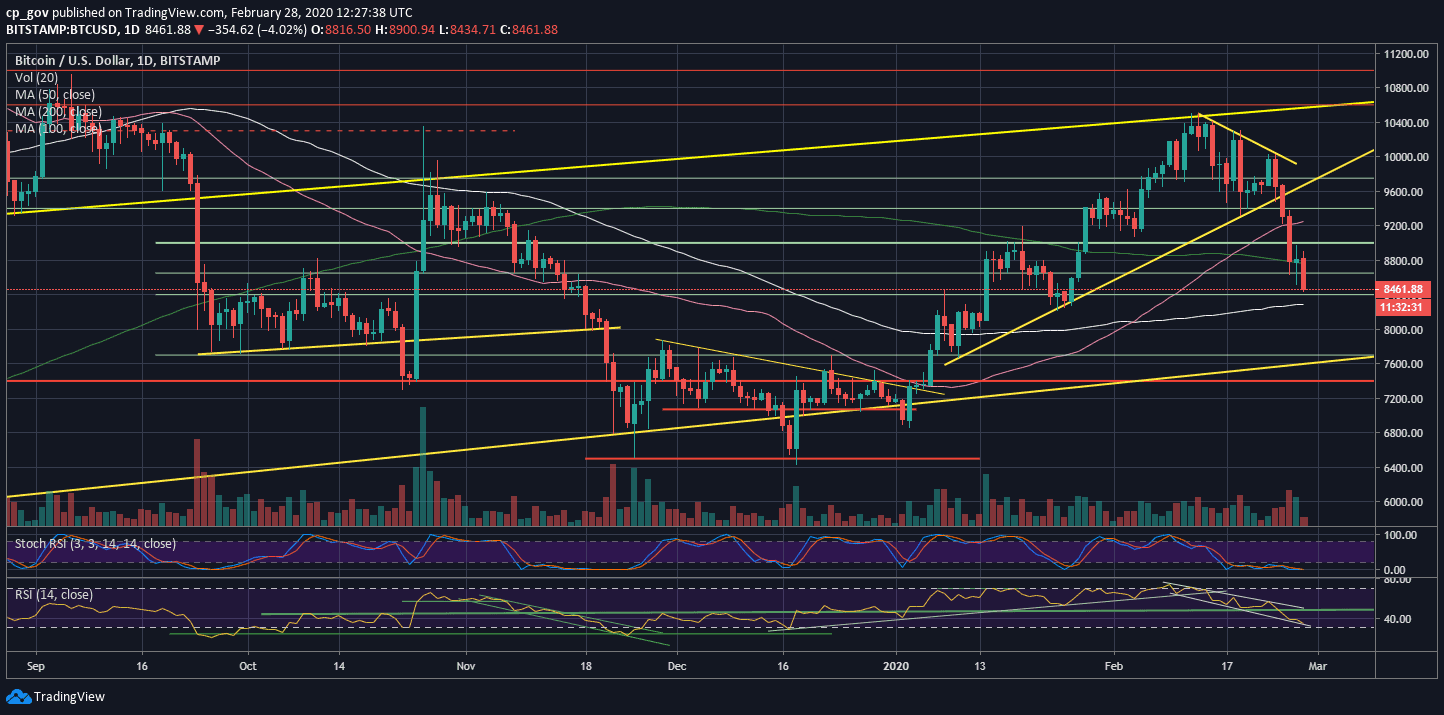
Looking at the bigger picture, which is the weekly time-frame, we can see a significant level of support around the $8000 mark, which is the 61.8% Fibonacci retracement level. This could be the next major support for Bitcoin in the case $8400 – $8500 breaks down. There is also the 100-days moving average line (white line, around $8280 now) and a weaker support line around $8200.
The RSI Tells The (Bearish) Story
The daily RSI indicator is currently at its lowest value since November 2019, while Bitcoin was trading for $6400. This weakness reflects on the recent price action. The only positive outcome that might be is of a bullish pennant, which is starting to form here. However, the formation is far from playing out.
Total Market Cap: $243 billion (in four days almost $50 billion evaporated)
Bitcoin Market Cap: $156.5 billion
BTC Dominance Index: 64.2%
*Data by CoinGecko
Key Levels To Watch & Next Possible Targets
– Support/Resistance levels: From below – levels are stated above.
From the bullish side, in case that Bitcoin maintains the $8400 – $8500 support level, then the first level of resistance would be $8800 (the MA-200), followed by $9000. Further above lies $9200, and $9480 support turned resistance levels.
– The RSI Indicator: discussed above.
– Trading volume: Wednesday’s bearish price action carried the third-highest volume candle since 2020 began. The bears are here!
BTC/USD BitStamp 4-Hour Chart
BTC/USD BitStamp 1-Day Chart
The post Bitcoin Price Analysis: BTC Struggles To Maintain Critical Support Level, Drop To $8000 Very Soon? appeared first on CryptoPotato.
The post appeared first on CryptoPotato


