
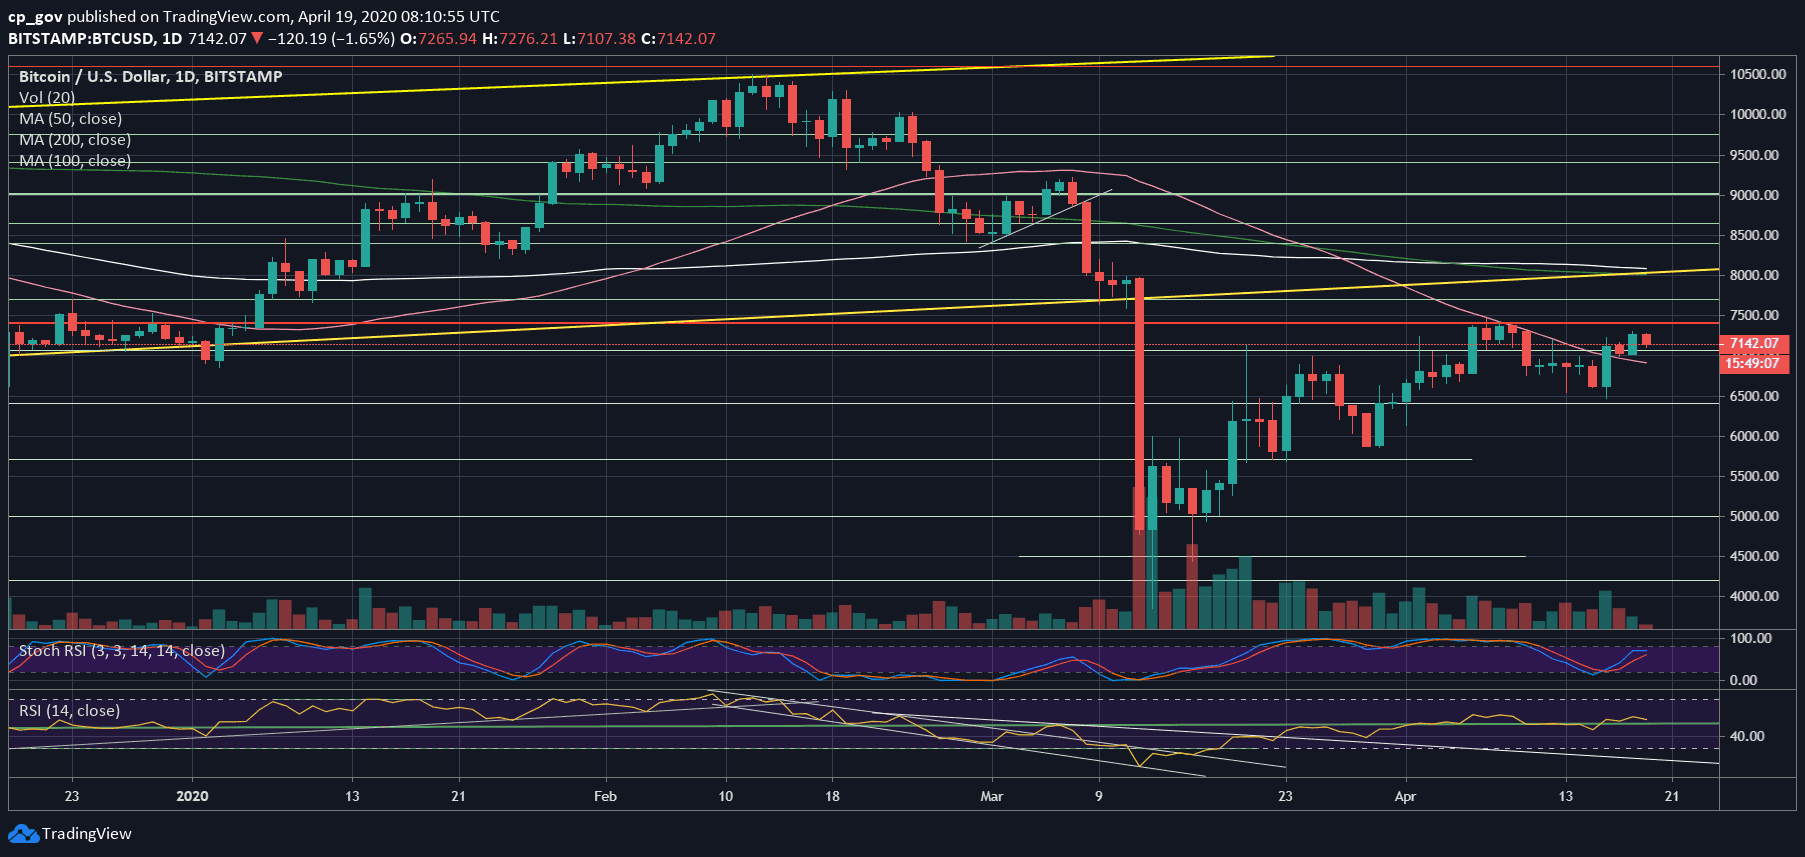
Over the past days since Thursday, we saw Bitcoin safely trading about the $7000 mark. During last Thursday, Bitcoin surged to over $7K, breaking above the critical 50-days moving average line (marked pink on the following daily chart).
Since then, and together with the bullish wind form Wall Street (3% gains on Friday), Bitcoin topped at $7306 (Bitstamp) as of yesterday. Over the past hours, Bitcoin is having a small correction below $7200. However, the critical area from below is still the MA-50 line – currently around $6940, along with the $7K mark.
From the bullish side, we can mention the massive volume of Thursday’s reversal candle. That was the highest volume day since April 2nd. After gaining over $800 in two days, it’s reasonable to see Bitcoin correcting down.
As of now, the bulls will watch the crucial level of $7400 – $7500. The latter contains the monthly high from ten days ago, along with a mid-term descending trend-line. There is always the fear of a double-top pattern that can quickly turn to a bearish setting.
Total Market Cap: $208.4 billion
Bitcoin Market Cap: $132 billion
BTC Dominance Index: 63.4%
*Data by CoinGecko
Key Levels To Watch & Next Possible Targets
– Support/Resistance levels: As mentioned above, Bitcoin reached $7300 and got rejected. From below, the initial support is the prior resistance at $7150 – $7200. Below lies the $7K price area, along with the 50-days moving average line (the pink line on the daily chart). Further below lies $6800, and $6600.
From above, after $7300, lies the significant resistance area at the $7400 – $7500 (April’s high), as discussed above. Further above lies $7700.
– The RSI Indicator: After breaking back above the 50 mark, the RSI looks a bit tired. There is a bit of bearish price divergence on the daily chart.
– Trading volume: As mentioned above, Thursday was the second-highest volume day, month to date. Friday and Saturday saw a decreasing amount of volume, in anticipation of the next big move.
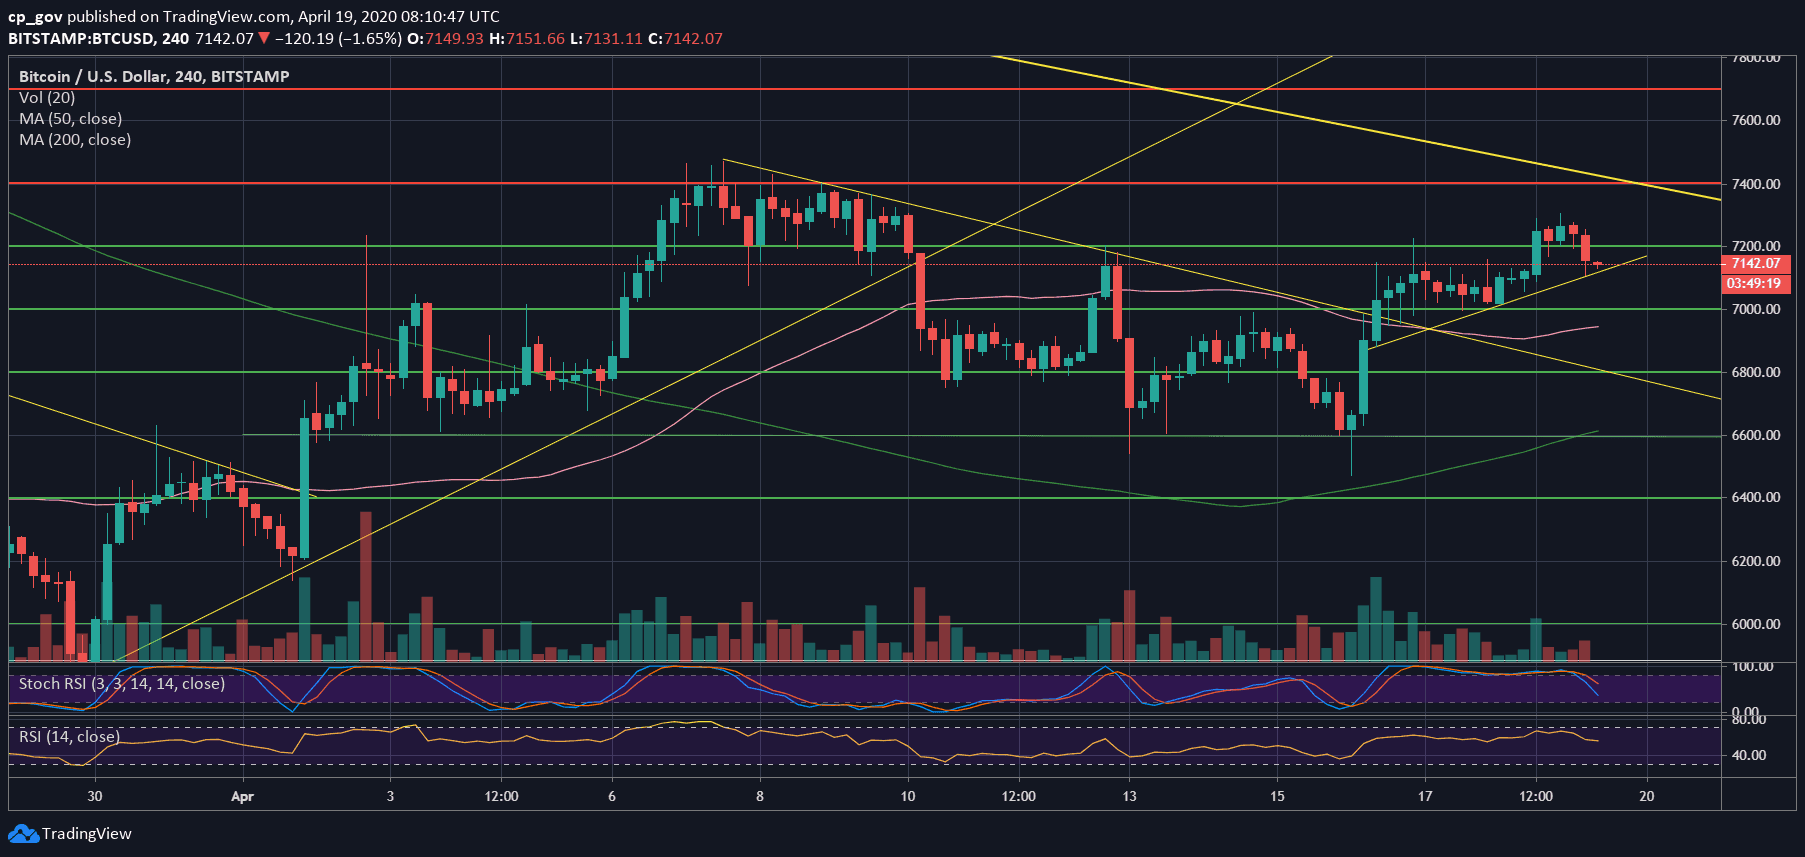
BTC/USD BitStamp 4-Hour Chart
BTC/USD BitStamp 1-Day Chart
The post Bitcoin Price Analysis: BTC Trading Safely Above $7000 – Can We See a New Monthly High Soon? appeared first on CryptoPotato.
The post appeared first on CryptoPotato


