
A close above the critical level of $9,300 on today’s daily candle would put the primary cryptocurrency in an excellent position for another retest of the main psychological barrier at $10,000 (but hey, there is some resistance in between!).
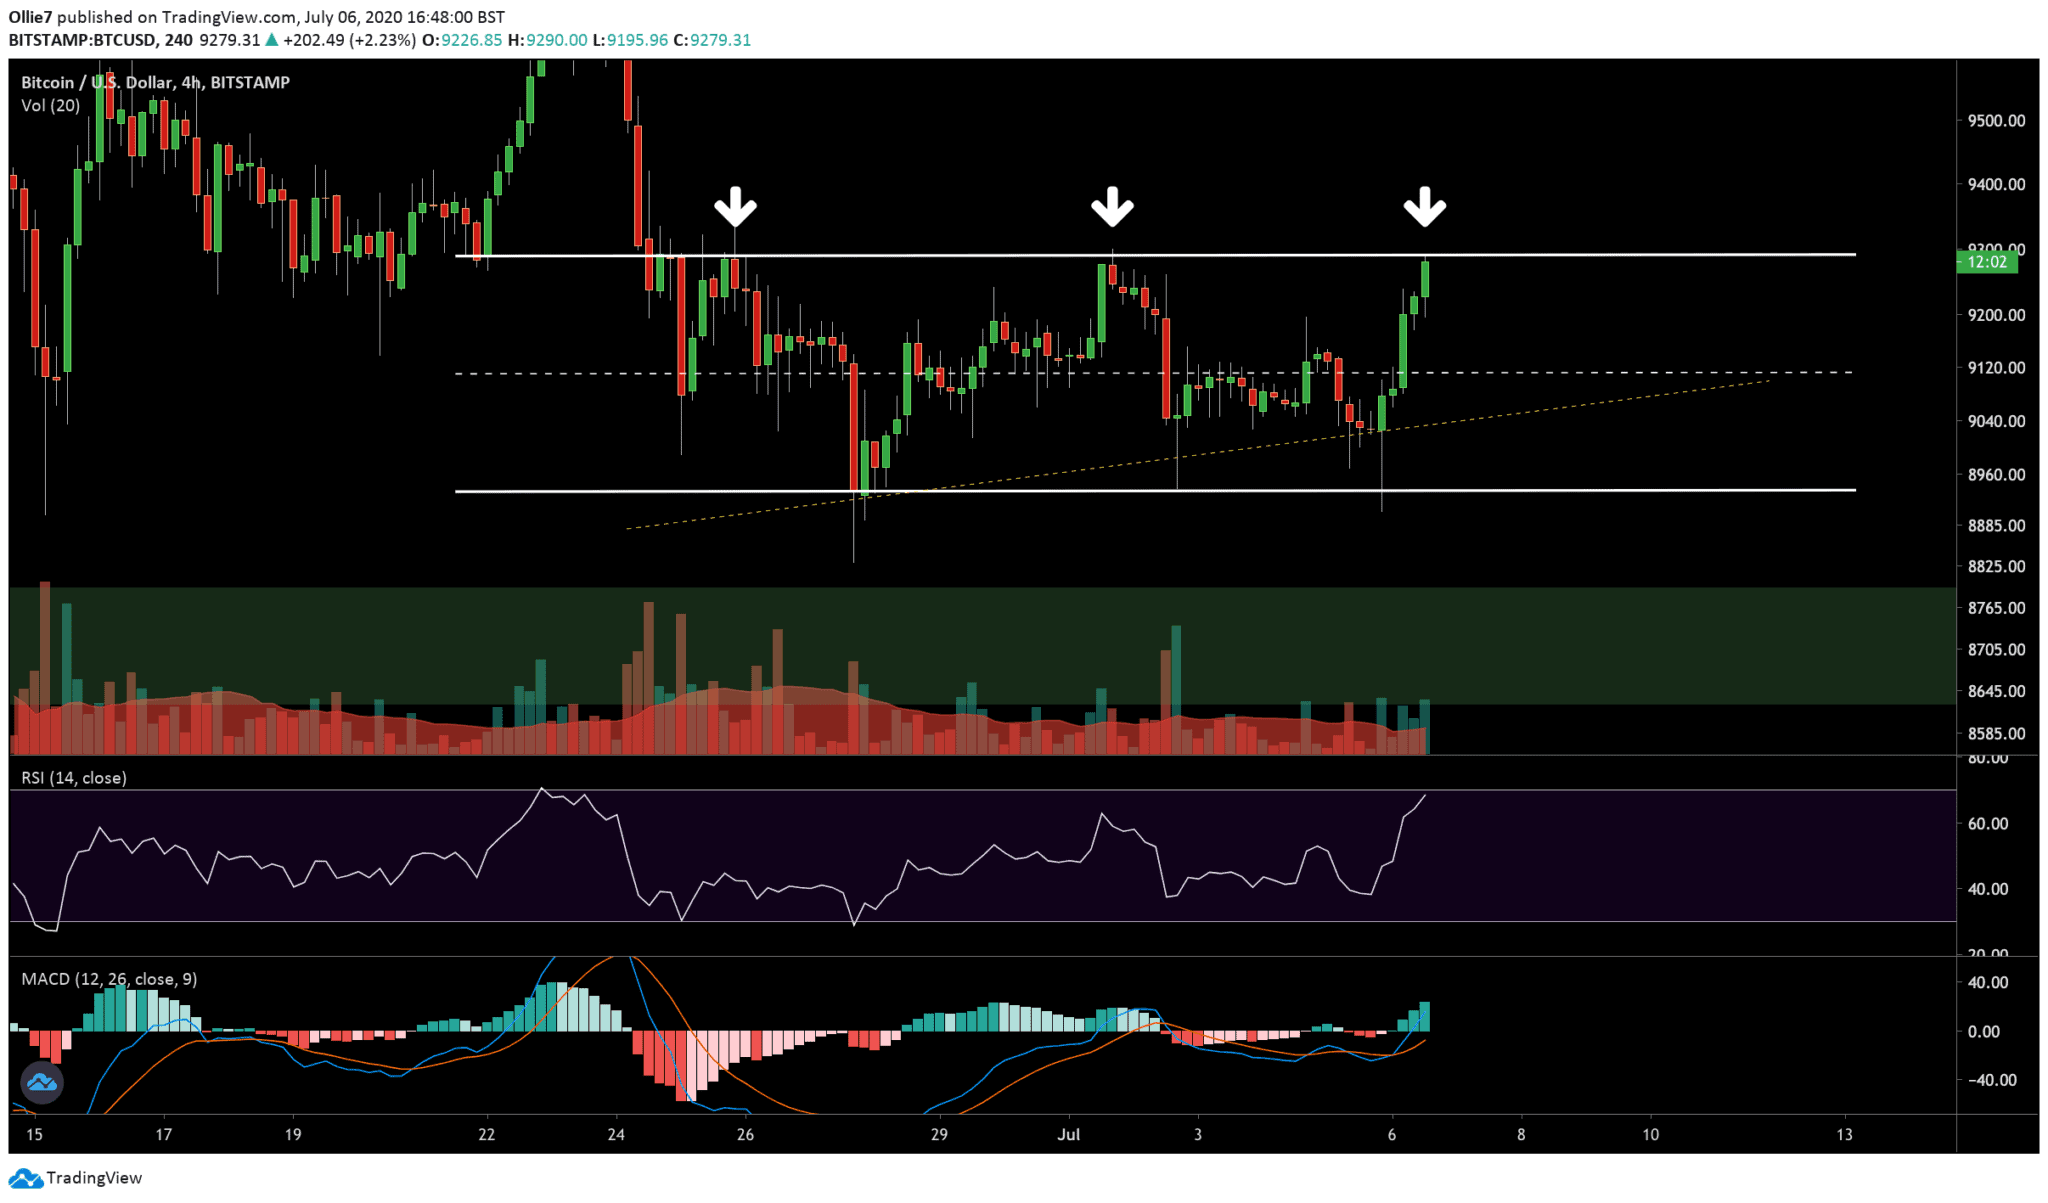
There is likely to be a lot of intense selling pressure at this point, however, as this particular level has already forced back two breakout attempts in the last ten days (see the 4-hour chart below).
The $9,300 resistance will need considerable volume to breakthrough, whereas this will be a good indication of bullish confidence going into the rest of this week if it’s achieved.
Bitcoin Price Levels to Watch in the Short-term
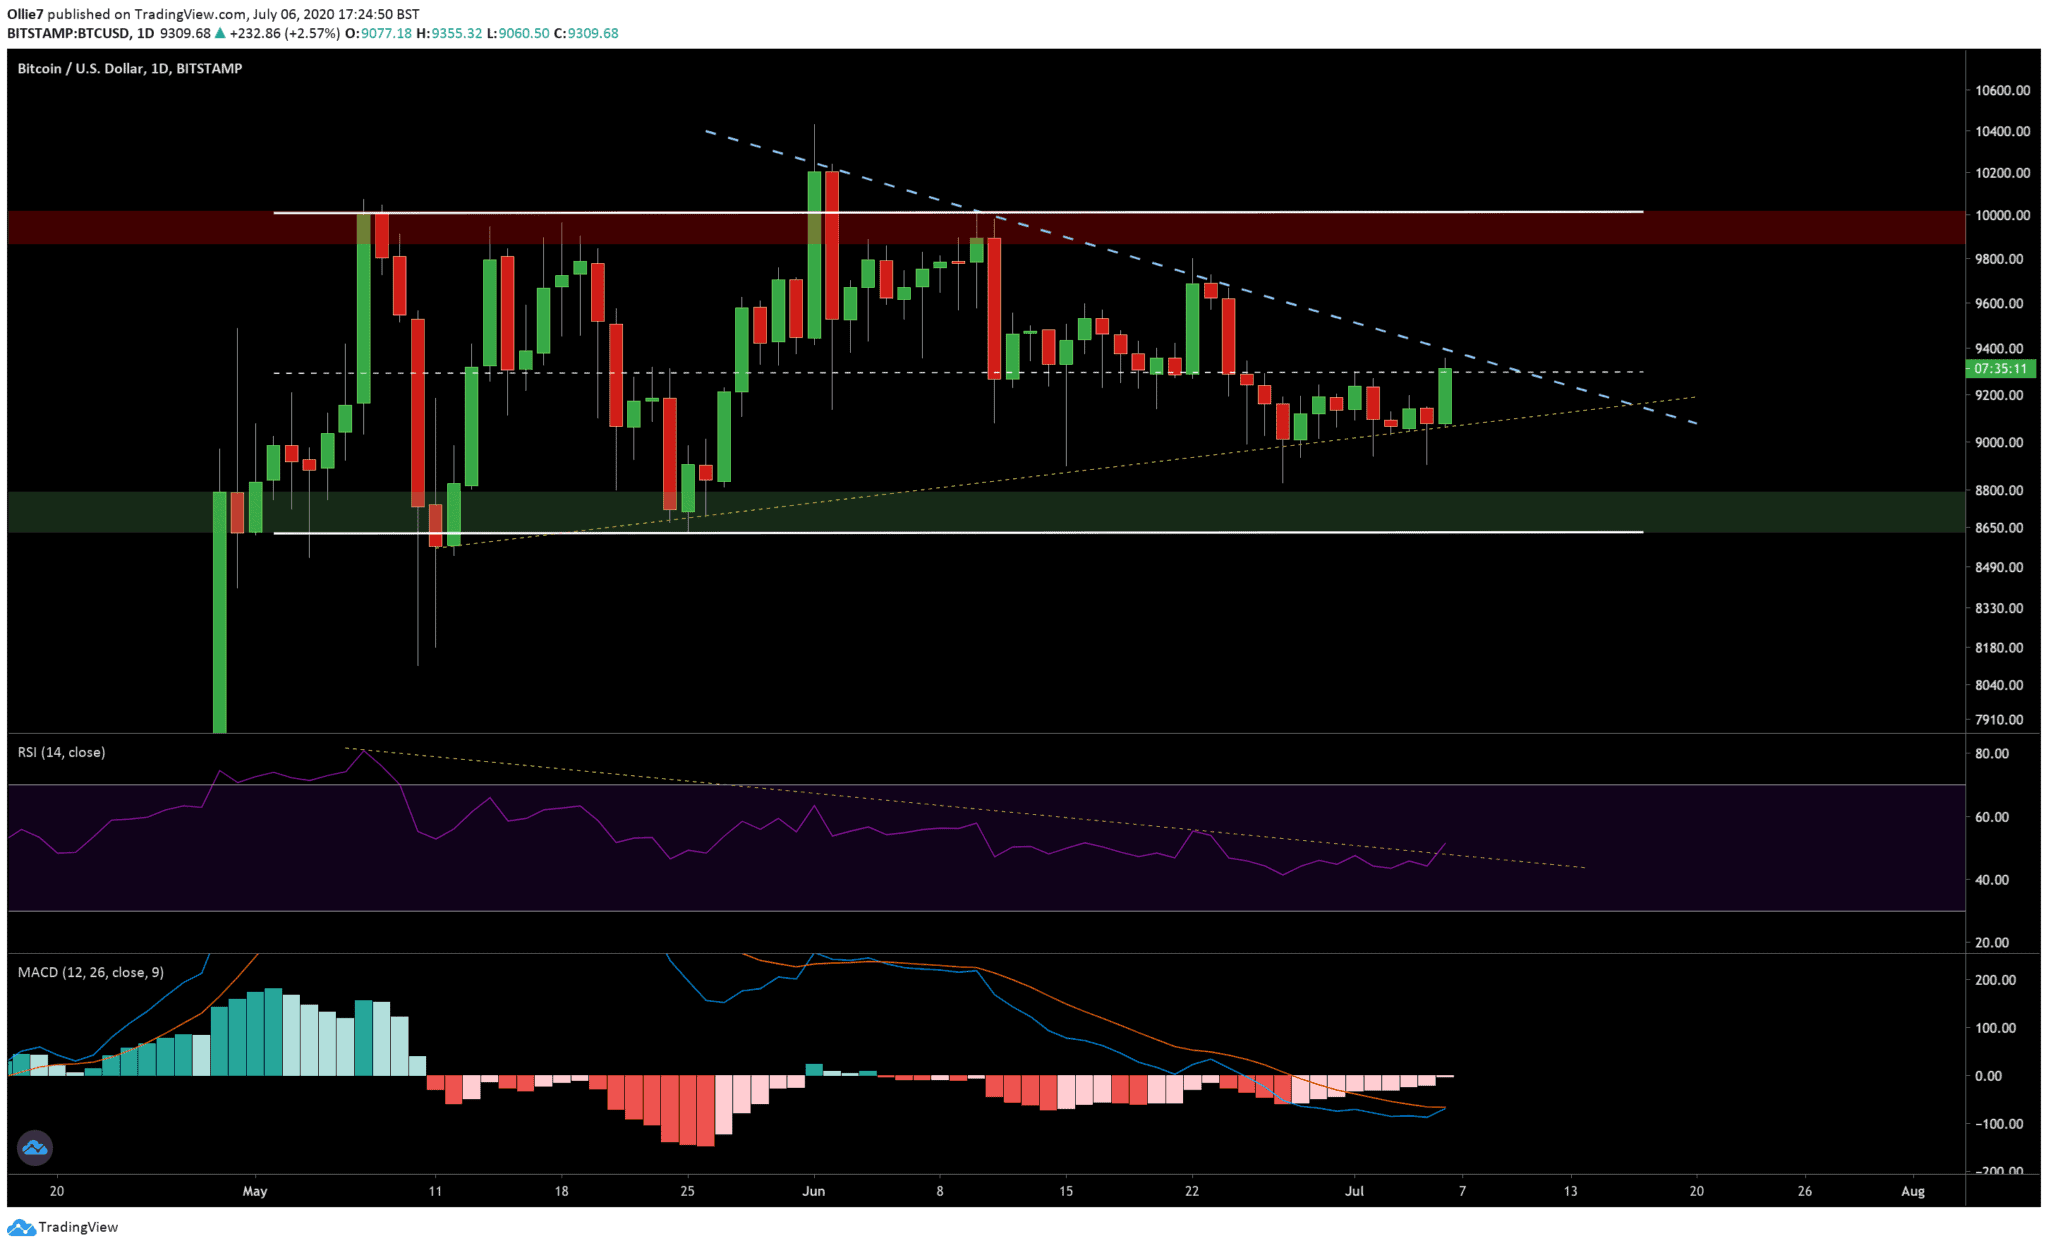
If the current bullish momentum continues, then the next area, which will likely cause some friction in the uptrend will be around the down-trending resistance that connects bitcoin’s lower highs (see dotted blue line on the daily chart), at approximately $9,400. We might even see prices wick above this line and get deflected off the stronger resistance $9,500 above.
From there, the last hurdle before $10,000 will most likely be around the $9,800 mark. This particular resistance suppressed bitcoin prices on two occasions back in May and one time in early June.
If the bears regain control over the asset, however, and BTC prices fall back under $9,300, then we’ll continue to watch the $9,000 and 100EMA (on the daily timeframe) for support.
The Technicals
Looking at the lagging momentum indicators on the following 1D BTC/USD chart, we can see that the RSI has broken above the downtrend line, which is a promising sign of a reversal, and there’s the start of a bullish MACD convergence between the 12-day and 26-day moving averages.
On the 4-hour MACD, the moving averages have now risen over the zero line which suggests short-term momentum has turned favorably bullish. On the RSI, however, the asset is now well into the oversold, which adds pressure to bullish traders and means a brief correction could occur soon.
Total market cap: $272 billion
Bitcoin market cap: $167.2 billion
Bitcoin Dominance Index: 62.8%
BTC/USD Bitstamp Daily Chart
BTC/USD Bitstamp 4-Hour Chart
Click here to start trading on BitMEX and receive 10% discount on fees for 6 months.
Disclaimer: Information found on CryptoPotato is those of writers quoted. It does not represent the opinions of CryptoPotato on whether to buy, sell, or hold any investments. You are advised to conduct your own research before making any investment decisions. Use provided information at your own risk. See Disclaimer for more information.
The post appeared first on CryptoPotato


