
Bitcoin’s price has just closed underneath the primary channel support (yellow line) on the daily chart for the first time since April 26, 2020 – over 151 days ago.
This could spell doom for the leading crypto’s short to mid-term prospects unless significant bullish volume arrives to drive BTC back into the up-trending channel.
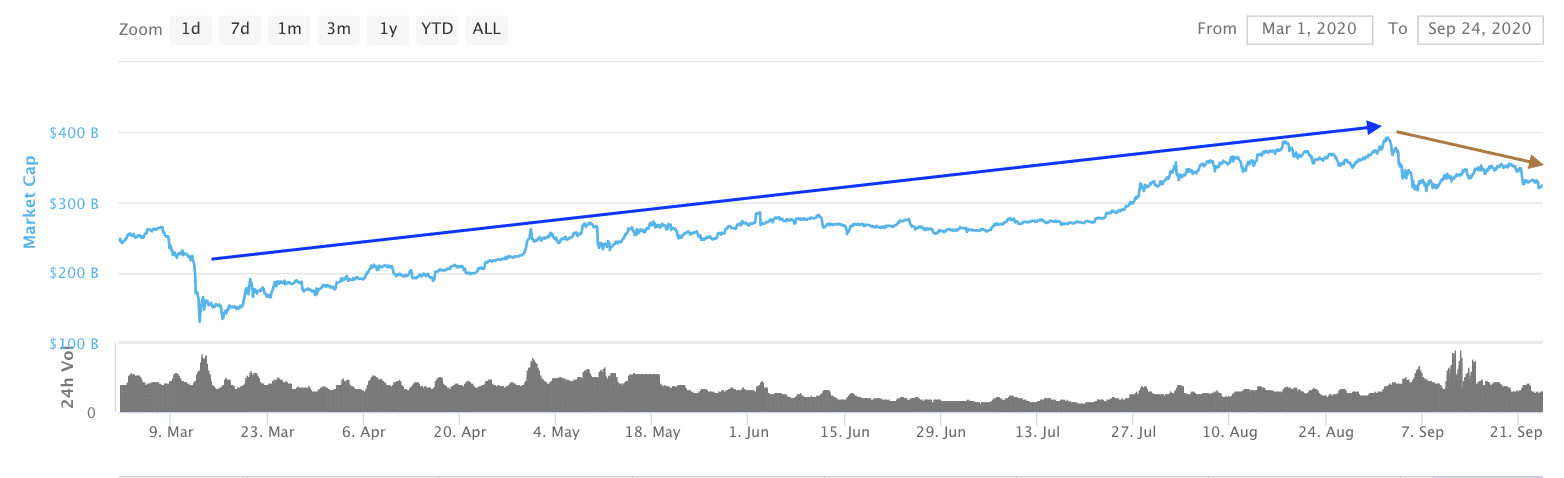
According to data by Coinmarketcap, the global crypto market cap has also fallen back under $325 billion and set a new lower high for the first time since the extreme Coronavirus crash in March 2020 (see red arrow). This is usually a strong indication that the market has now turned favorably bearish.
BTC Price Levels to Watch in the Short-term
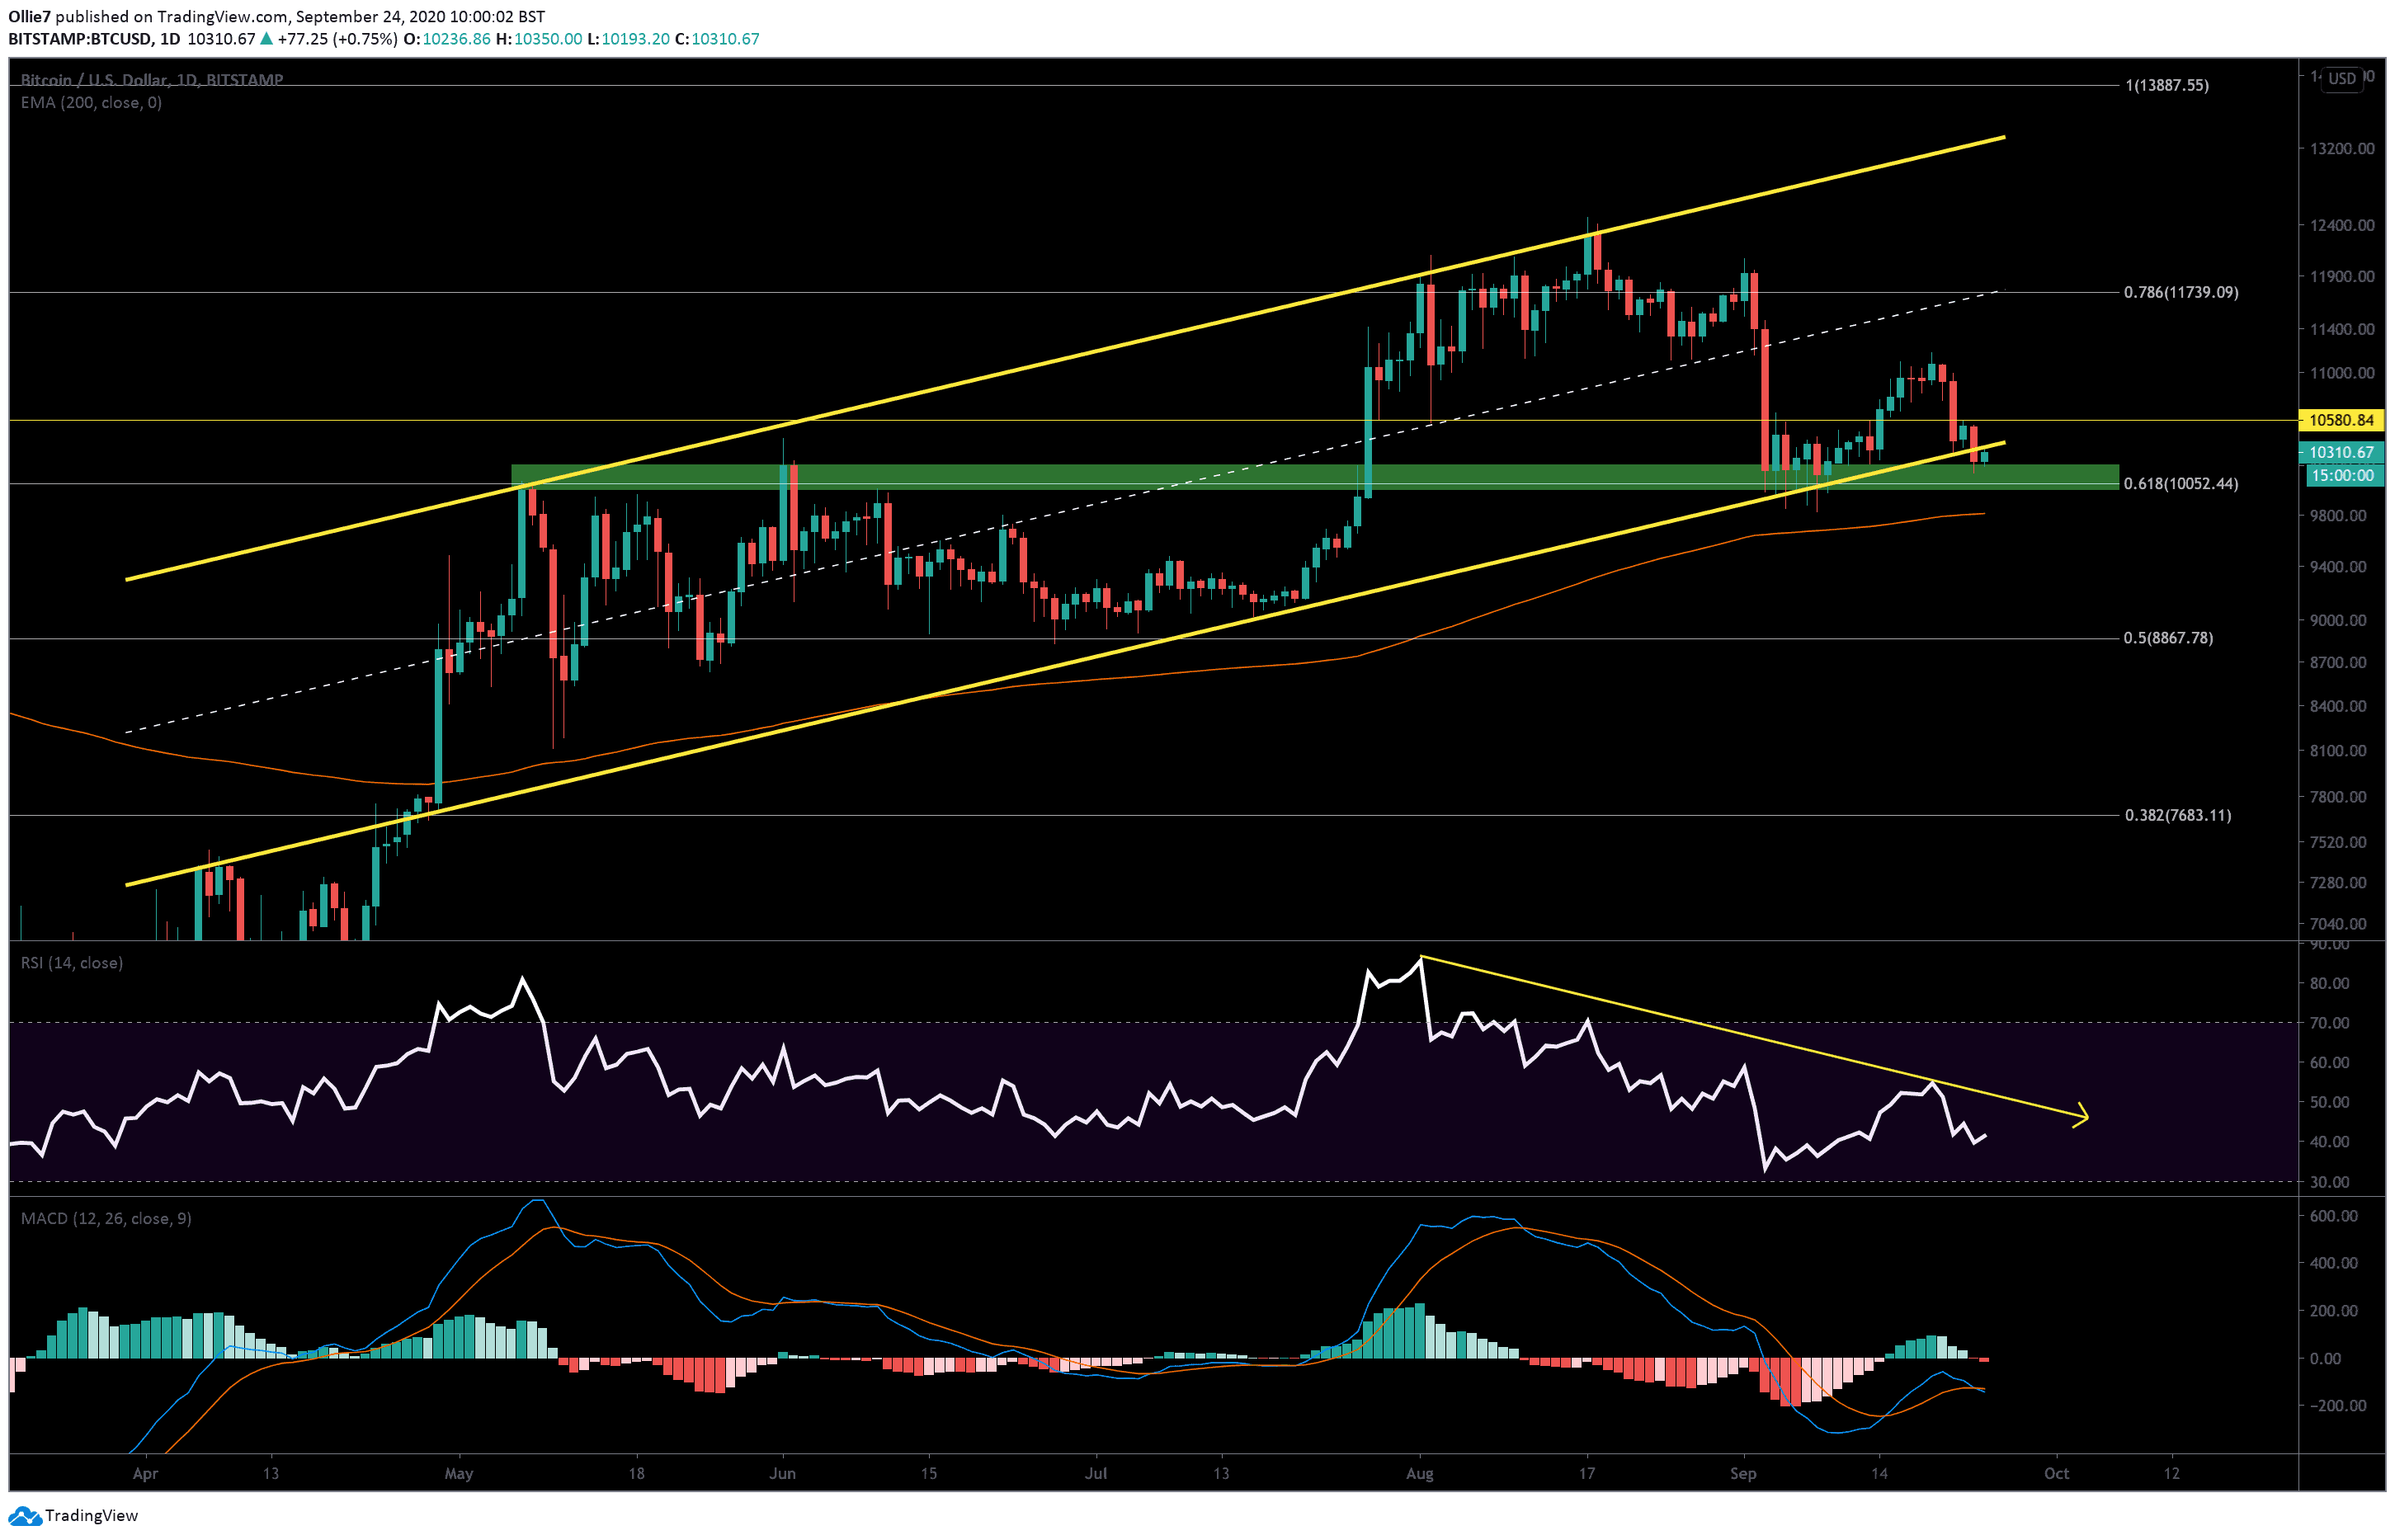
On the daily BTC/USD chart, we can see that the price is hovering above the critical support-resistance zone (green) at around $10,200 – $10,000.
This particular area is also reinforced by the 0.618 Fibonacci level, which previously acted as a strong resistance for Bitcoin back in May and June this year.
Bullish traders are currently using this solid foothold to attempt a re-entry back into the main channel above $10,380.
This is a crucial moment for BTC. Failing to break this resistance will likely result in a lack of confidence in the leading asset and further downside towards $10,000 and even the unfilled CME gap below at $9,665 – $9,925.
If this does happen, the 200-EMA (red line) at $9,800 will likely be one of the first supports to help slow down the decline. From there, the bottom of the CME gap at $9,665 should also provide a rebound opportunity for bulls once it finally closes. Other supports lower down can be found at $9,160 and the 0.5 Fibonacci level at $8,867.
The daily RSI adds further confirmation that Bitcoin’s price will likely continue to decline. There’s been a noticeable divergence between the price action and the RSI since August 1 (yellow arrow on RSI), which usually indicates that the trend is weakening. The daily MACD is also decidedly bearish, with selling volume appearing on the histogram as well as a bearish divergence between the 12 and 24 moving averages.
Total market capital: $329 billion
Bitcoin market capital: $190 billion
Bitcoin dominance: 57.9%
*Data by Coingecko.
Bitstamp BTC/USD Daily Chart
Binance Futures 50 USDT FREE Voucher: Use this link to register & get 10% off fees and 50 USDT when trading 500 USDT (limited – first 200 sign-ups & exclusive to CryptoPotato).
Click here to start trading on BitMEX and receive 10% discount on fees for 6 months.
Disclaimer: Information found on CryptoPotato is those of writers quoted. It does not represent the opinions of CryptoPotato on whether to buy, sell, or hold any investments. You are advised to conduct your own research before making any investment decisions. Use provided information at your own risk. See Disclaimer for more information.
The post appeared first on CryptoPotato


