
Despite the raging volatility of the global markets due to the coronavirus, Bitcoin is acting as a stable coin, and over the past week, we had seen it trading between $8500 and $9000, which is roughly a 5.6% price range.
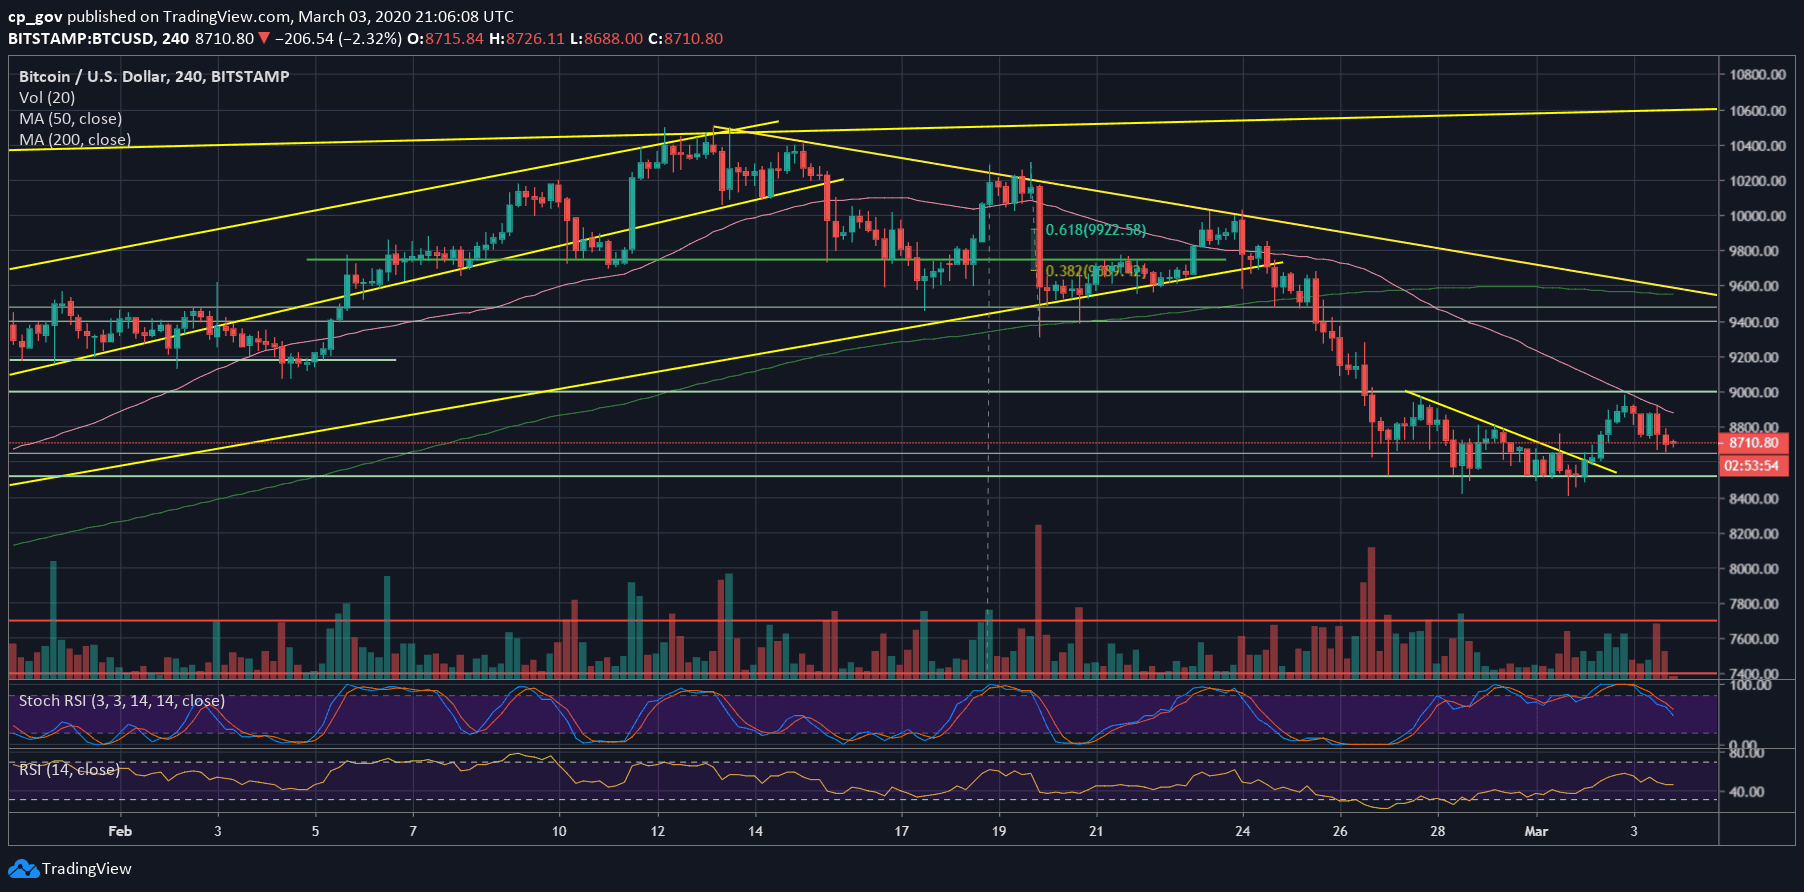
Since the previous analysis from two days ago, Bitcoin had broken above our marked triangle (on the following 4-hour chart), and surged to the next resistance level at $9000, along with the 4-hour’s 50 moving average line (the pink line).
There, the primary cryptocurrency got rejected and dropped to resistance turned support price area at $8650. As of writing these lines, Bitcoin is trading around $8700.
The Positive Correlation
The amazing thing is the positive correlation between Bitcoin and Wall Street over the past week. The only difference is that Wall Street’s price moves are a lot sharper than Bitcoin’s, which is very uncommon.
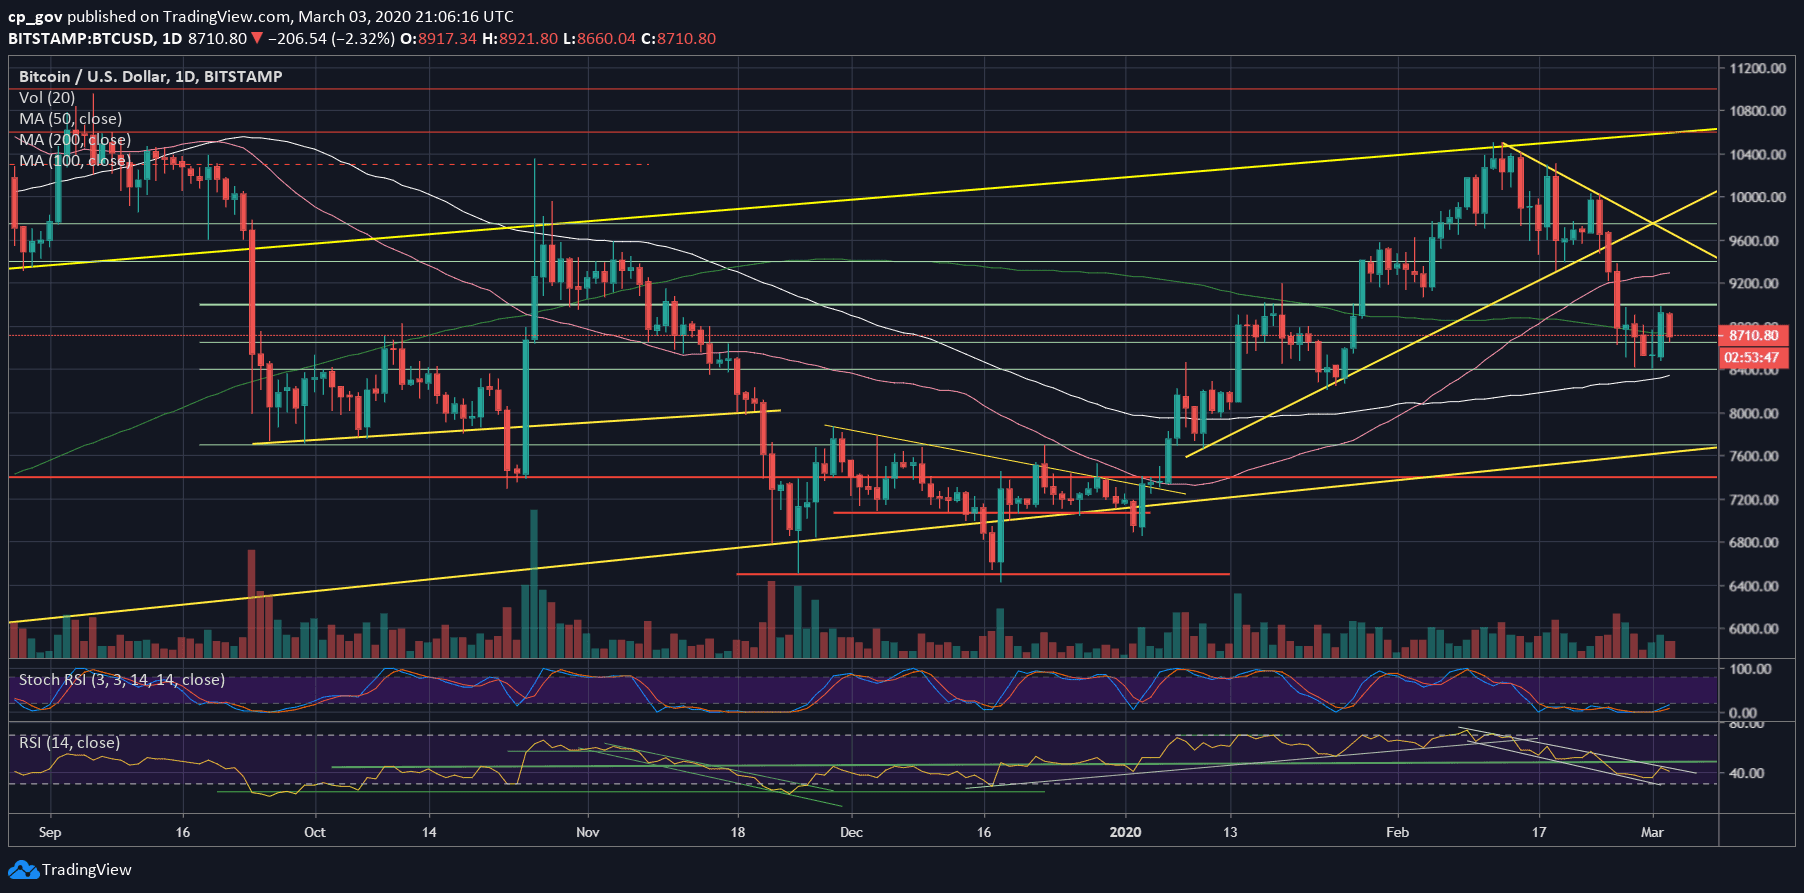
As mentioned above, Bitcoin is showing stability over the past days and trading around the significant 200-days moving average line (marked light green on the following daily chart, currently around $8750).
Total Market Cap: $249.7 billion (in four days almost $50 billion evaporated)
Bitcoin Market Cap: $159.2 billion
BTC Dominance Index: 63.8%
*Data by CoinGecko
Key Levels To Watch & Next Possible Targets
– Support/Resistance levels: Following the recent price action, Bitcoin is now facing $8750 – $8800 as the first resistance level. This includes the MA-200 line.
In case of a breakup, the next resistance lies at $9000, which is the weekly high. Further above lies $9300, which is also the 50-days moving average line (marked pink).
From below, the first level of support is today’s low at $8650. Below lies the $8400 – $8500 support area, which is the low that held nicely over the past week (along with the 100-days moving average line currently around $8350).
Further down is $8200 and the $8000 level, which is the 61.8% Fibonacci retracement level of the recent bullish move to $10,500 (mid-February).
– The RSI Indicator: As mentioned here over the past week, the RSI is forming a descending channel since February 9. This can be seen in the following chart.
A break-up from the channel and a higher-high is a crucial condition for Bitcoin to turn bullish for the next short-term. As of now, Bitcoin is testing the channel’s upper trend-line, as resistance.
The stochastic RSI oscillator had made a cross-over in the oversold territory, and about to enter the neutral zone, which might lead to a bullish move.
– Trading volume: We can identify an increasing amount of volume over the past days, which can turn to bullish signs. However, the volume levels are not significant and are lower than the monthly average.
BTC/USD BitStamp 4-Hour Chart
BTC/USD BitStamp 1-Day Chart
The post Bitcoin Price Analysis: Despite Global Markets’ Volatility, Bitcoin’s Showing Stability – The Calm Before The Storm? appeared first on CryptoPotato.
The post appeared first on CryptoPotato


