
Following the huge price dump last Wednesday, we saw Bitcoin trading in the tight range between $9550 and $9750 until a few hours ago, where the primary cryptocurrency had decided to fire some engines towards a critical resistance level.
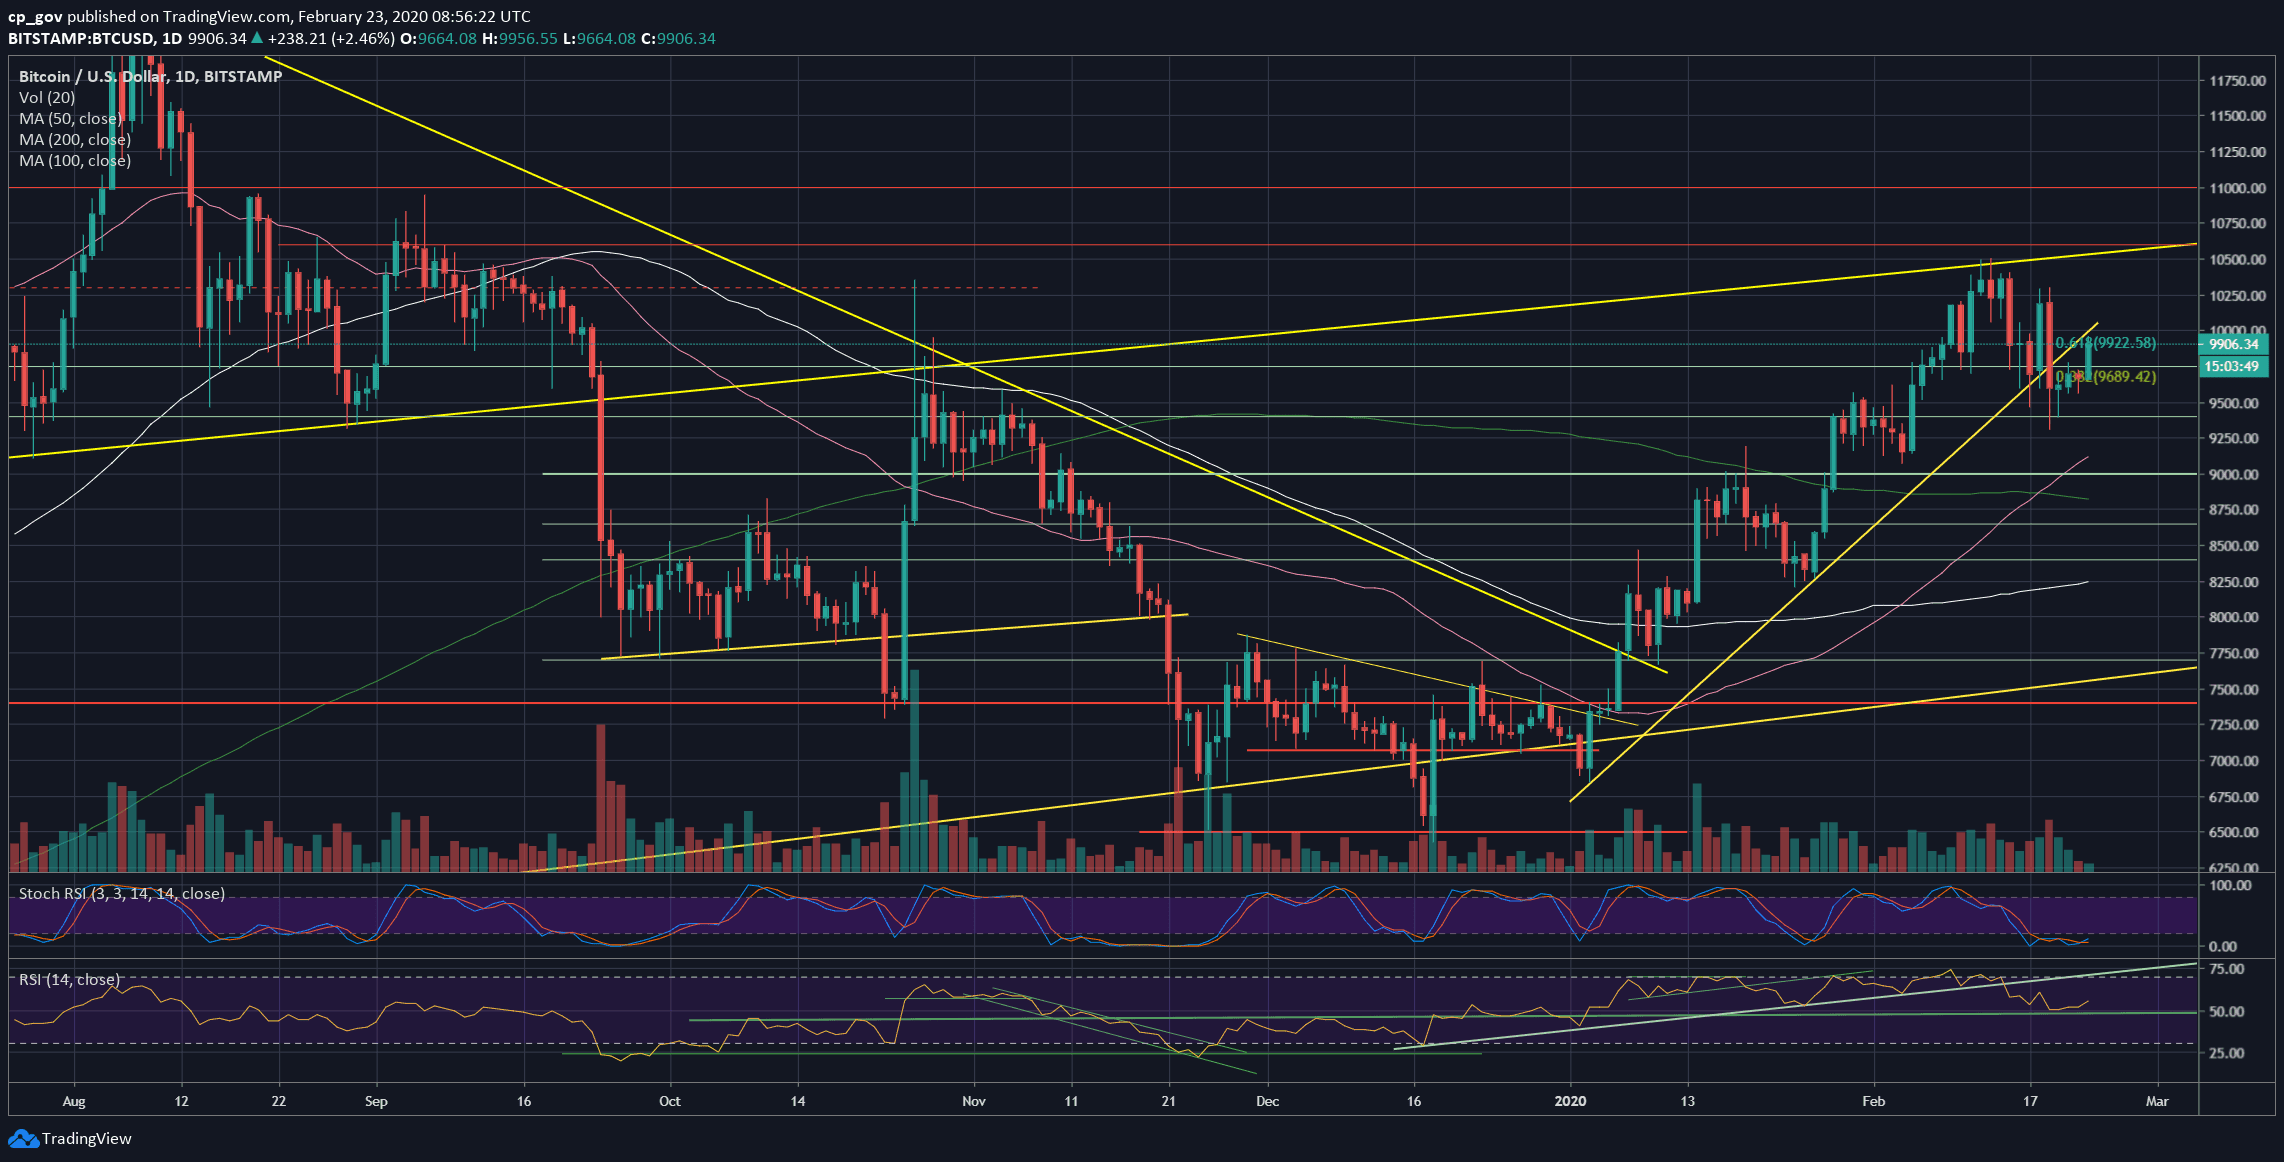
As of writing these lines, Bitcoin is testing the $9900 – $10,000 resistance. As mentioned in our previous analysis, the $9900 horizontal resistance is also the Golden Fib retracement level (61.8%, lies at $9922). As can be seen on the following daily chart, this resistance is also a retest of the mid-term ascending trend-line (marked yellow).
While Bitcoin is in the middle of another weekend, we need to keep in mind a possible CME Futures gap waiting at $9830. Those gaps usually tend to get filled very quickly.
Total Market Cap: $286 billion
Bitcoin Market Cap: $179.6 billion
BTC Dominance Index: 62.7%
*Data by CoinGecko
Key Levels To Watch & Next Possible Targets
– Support/Resistance levels: As mentioned above, the first level of resistance is the Golden Fib level (61.8%) at $9922, before the $10,000 benchmark. Higher above lies the past week’s high of $10,200 – $10,300, followed by $10,500 – where lies the current 2020 high.
From below, the first significant level of support lies at $9750. Further below lies $9550, followed by $9400, before the weekly low of Wednesday, which lies at $9300.
– The RSI Indicator: After a huge drop to the 50 RSI levels, the indicator found the needed support, and since then showing bullishness.
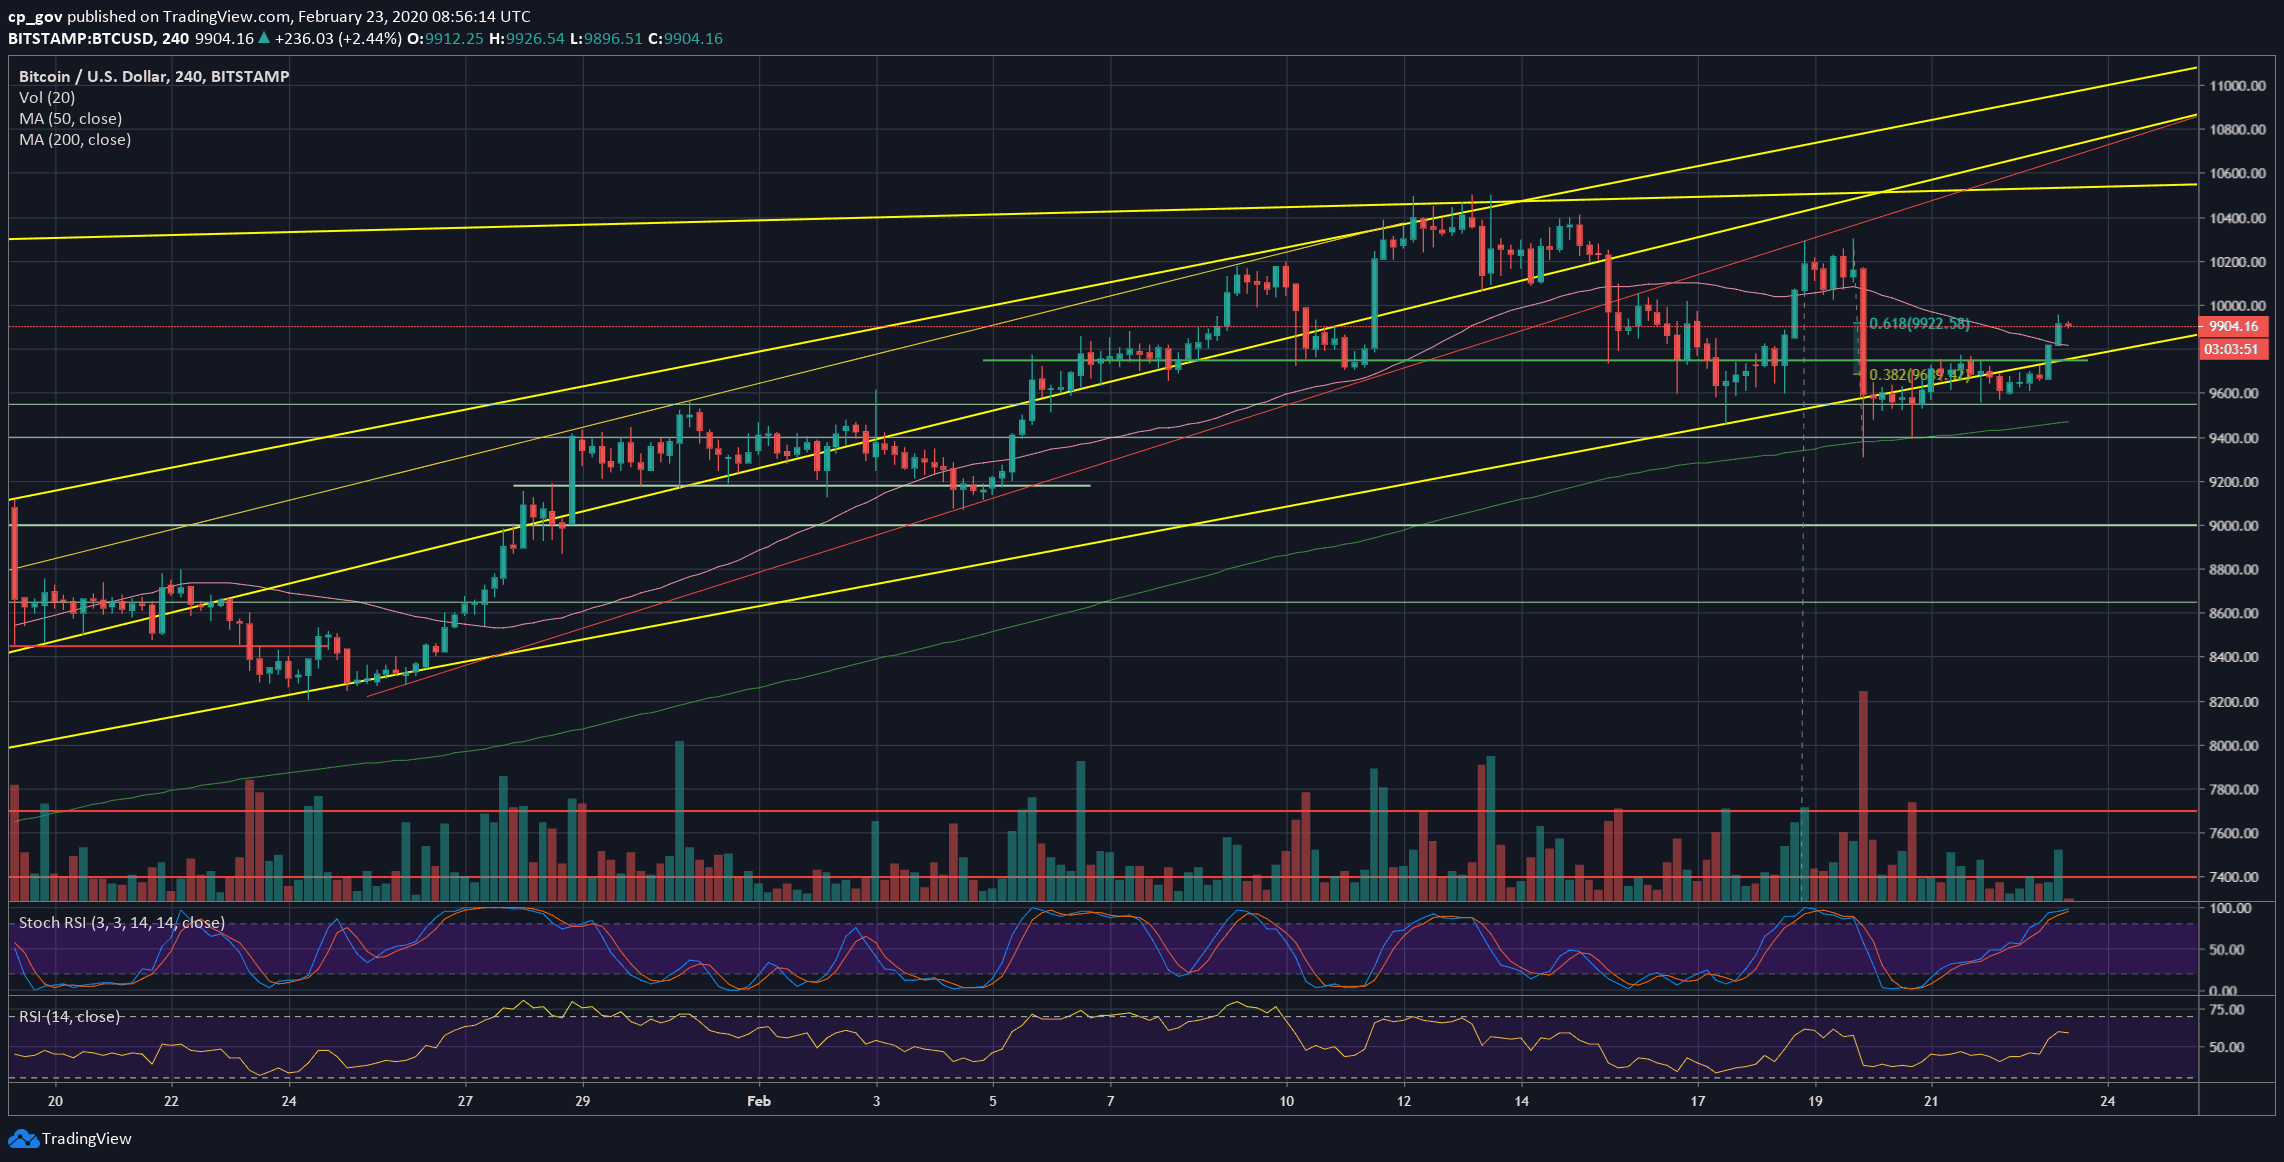
On the 4-hour chart (the lower time-frame), we can see a little bit of bullish price divergence starting to develop, which could be fuel for the next move up.
In addition, the Stochastic RSI oscillator had made a crossover in the oversold territory, and now about to enter the neutral zone, this could be another short-term bullish sign.
– Trading volume: Since Wednesday, we can see that the daily volume candles are declining. Yesterday had carried a minor amount of volume. This might be a sign that the next Bitcoin move is coming up. As a reminder, during weekends, the trading volume tends to be lower.
BTC/USD BitStamp 4-Hour Chart
BTC/USD BitStamp 1-Day Chart
The post Bitcoin Price Analysis: Following Decent $300 Surge – Is Bitcoin Ready To Conquer $10,000 Again, Or Just A Temp Correction? appeared first on CryptoPotato.
The post appeared first on CryptoPotato


