
Two days ago, our latest edition of Bitcoin price analysis had the promising title – “The calm before the storm.”
Yesterday we saw what a Bitcoin storm looks like: After recording a daily low at $9142 (Bitstamp), the coin had massively broken out from our mentioned Bull-Flag (at ~$9200), and from there, we witnessed the explosion.
Bitcoin price rallied up to the next resistance of $9700 – $9800, recording $9775 (Bitstamp) as the new 2020 high, as of writing these lines.
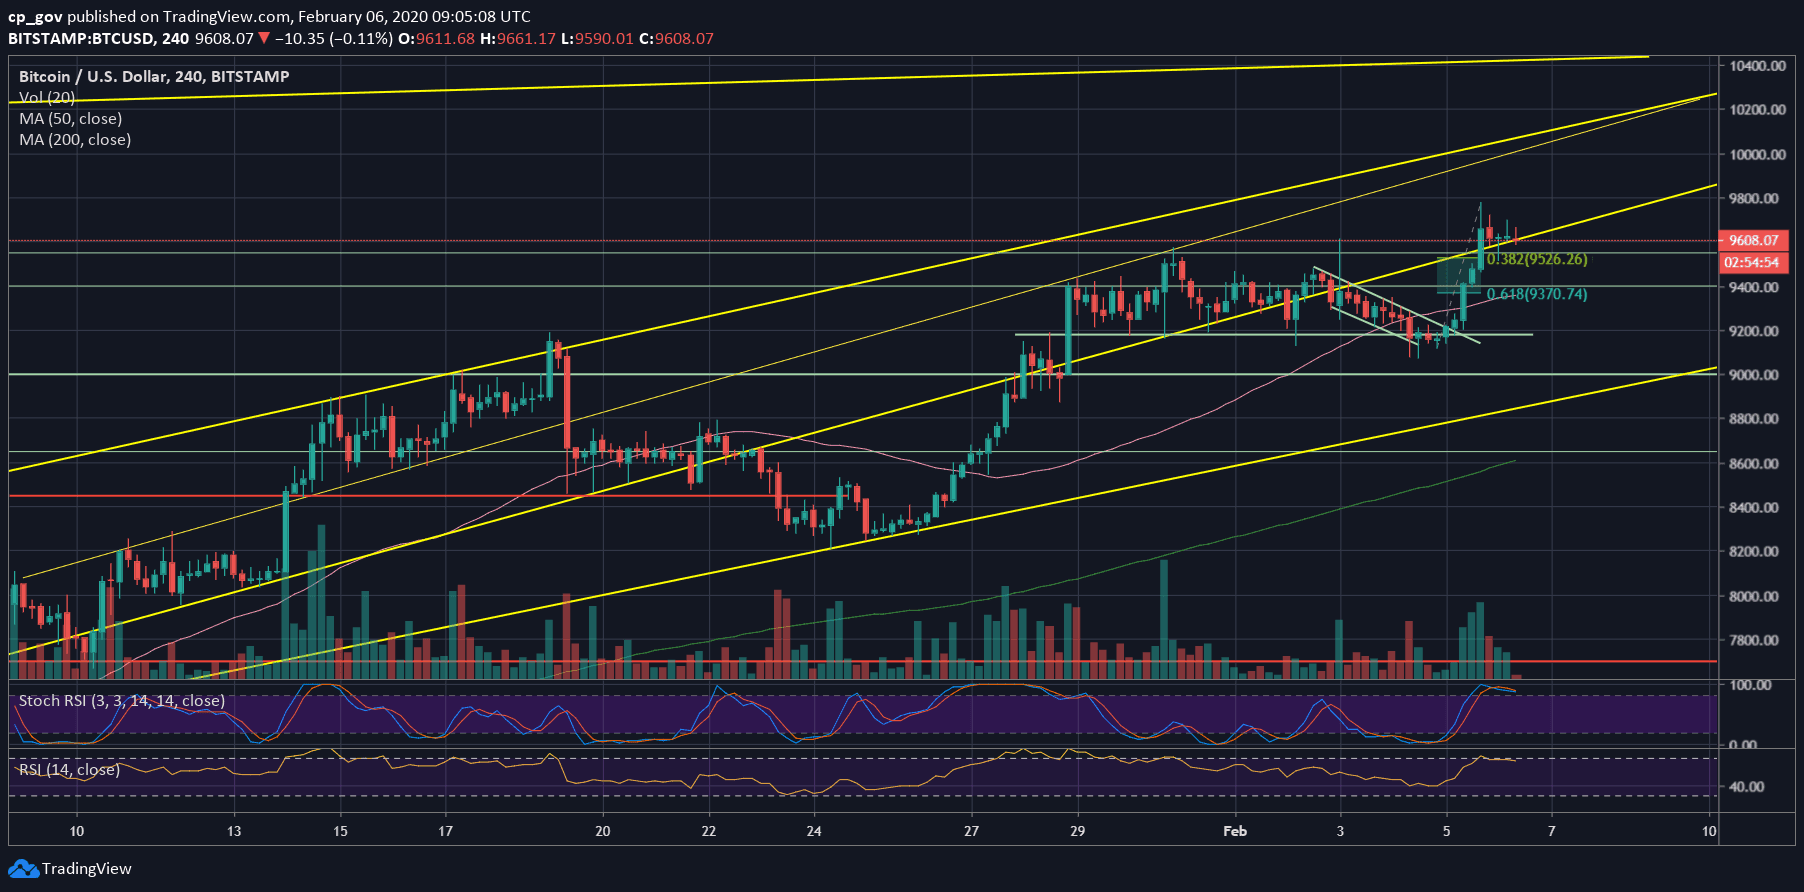
On the following 4-hour chart, we can see the clear breakout of the middle-marked ascending trend-line, along with the $9550 horizontal support line. In the hours after until now, Bitcoin had corrected precisely back to the trend-line, to confirm it as support, in anticipation for the next big move.
Overall, as we stated here many times over the past two weeks, the situation for Bitcoin is very bullish. All the recent corrections were neat and healthy, touched the 38.2% Fibonacci retracement level and continued the race upwards.
Total Market Cap: $273 billion
Bitcoin Market Cap: $175 billion
BTC Dominance Index: 64.1%
*Data by CoinGecko
Key Levels To Watch & Next Possible Targets
– Support/Resistance levels: Bitcoin is now taking some rest on the middle-marked ascending trend line, along with the $9550 – $9600 resistance turned support area.
Again, this is very healthy for building price demand areas at spots of prior resistance. The next resistance is the mentioned $9700 – $9800. In the likely case of a breakout, then the $10,000 benchmark would be the next resistance level, followed by $10,300 -$10,400 price area. Further above lies $10,600 and $11,000.
From below, the first level of support is $9600, followed by the 38.2% Fibonacci retracement level of $9526. Further down is resistance turned support $9400, along with Fib level 61.8%. As long as Bitcoin’s price trading above the last two levels, the momentum stays bullish.
– The RSI Indicator: As mentioned here, the RSI found the crucial support on the marked ascending trend-line, and from there, the bulls took control of the market.
As of now, the RSI is facing resistance at 70. The stochastic RSI oscillator had turned bullish, and the RSI supports bullish continuation.
– Trading volume: As expected, yesterday recorded the highest volume day for the past week. This massive volume supports the bullish momentum in the crypto markets.
BTC/USD BitStamp 4-Hour Chart
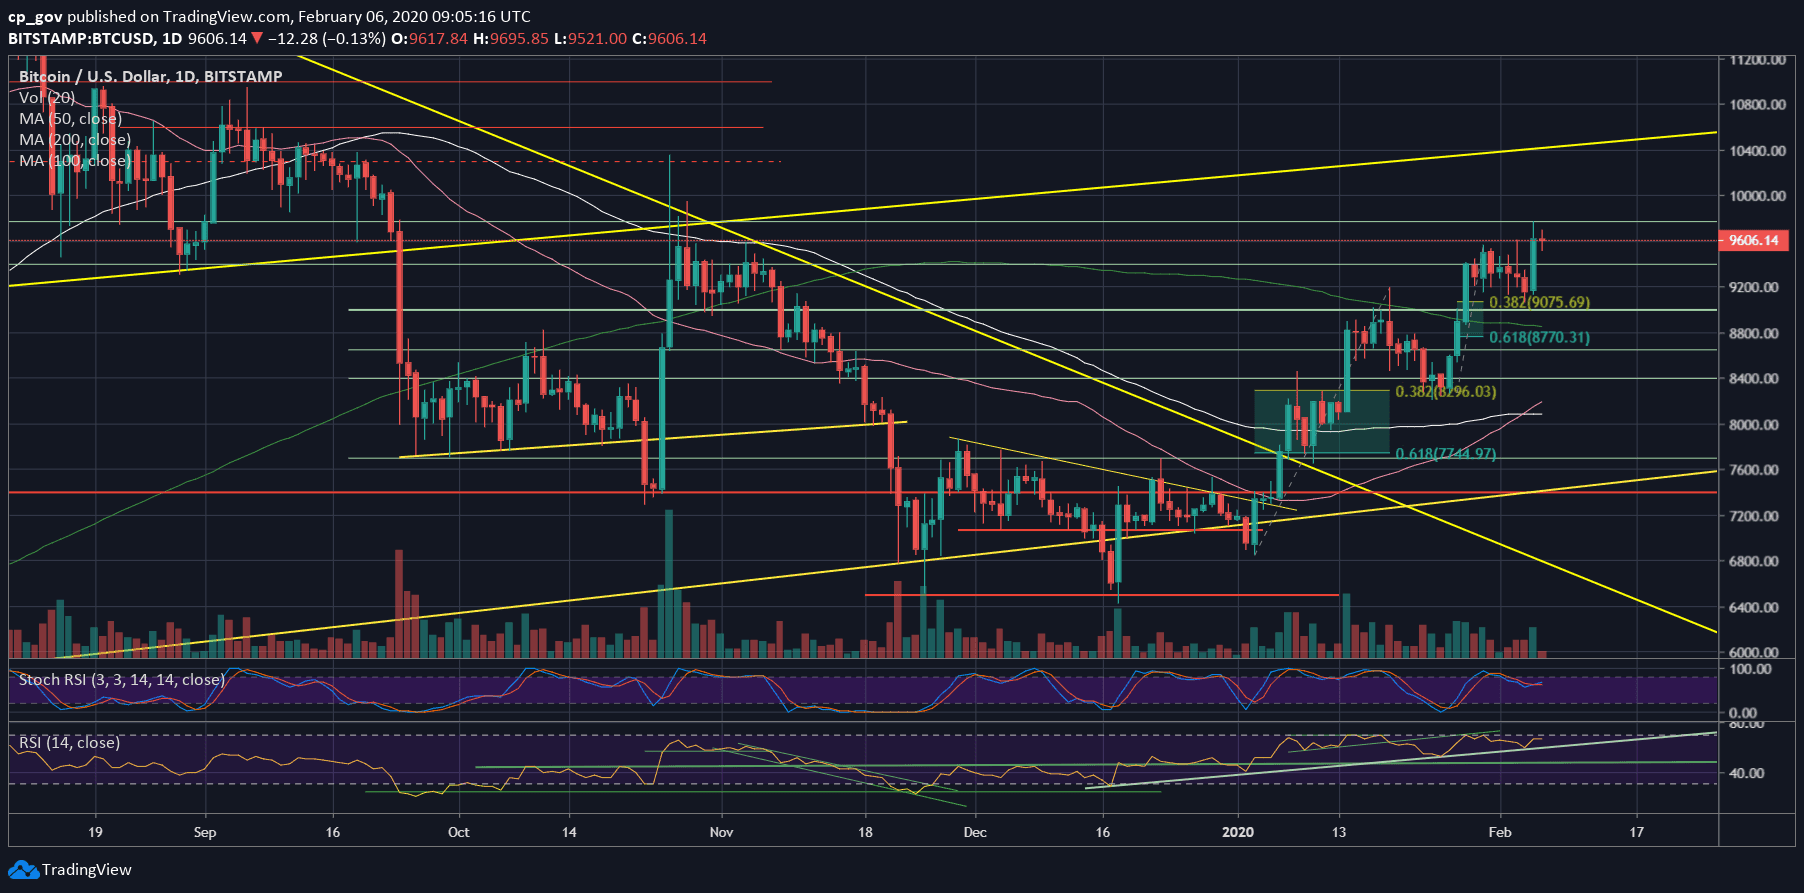
BTC/USD BitStamp 1-Day Chart
Disclaimer: Information found on CryptoPotato is those of writers quoted. It does not represent the opinions of CryptoPotato on whether to buy, sell, or hold any investments. You are advised to conduct your own research before making any investment decisions. Use provided information at your own risk. See Disclaimer for more information.
The post appeared first on CryptoPotato


