
Bitcoin price is soaring right now as the US legacy market opens up to begin the new week.
Just hours ago, the leading cryptocurrency had completed a bearish Bart Simpson pattern after crashing down to $11,175 following an extended period of sideways chop. It was looking as though the asset was about to head down to the 0.5 Fibonacci level at $11,150, but new bullish momentum from the American trading session has helped drive BTC back above $11,500. With this, Bitcoin charted a new 5-week high.
$10 billion has returned to the market in the last 2 hours along with $300 million in long interest at the $11,500 mark – according to data by Coinmarketcap and Datamish, respectively.
Price Levels to Watch in the Short-term
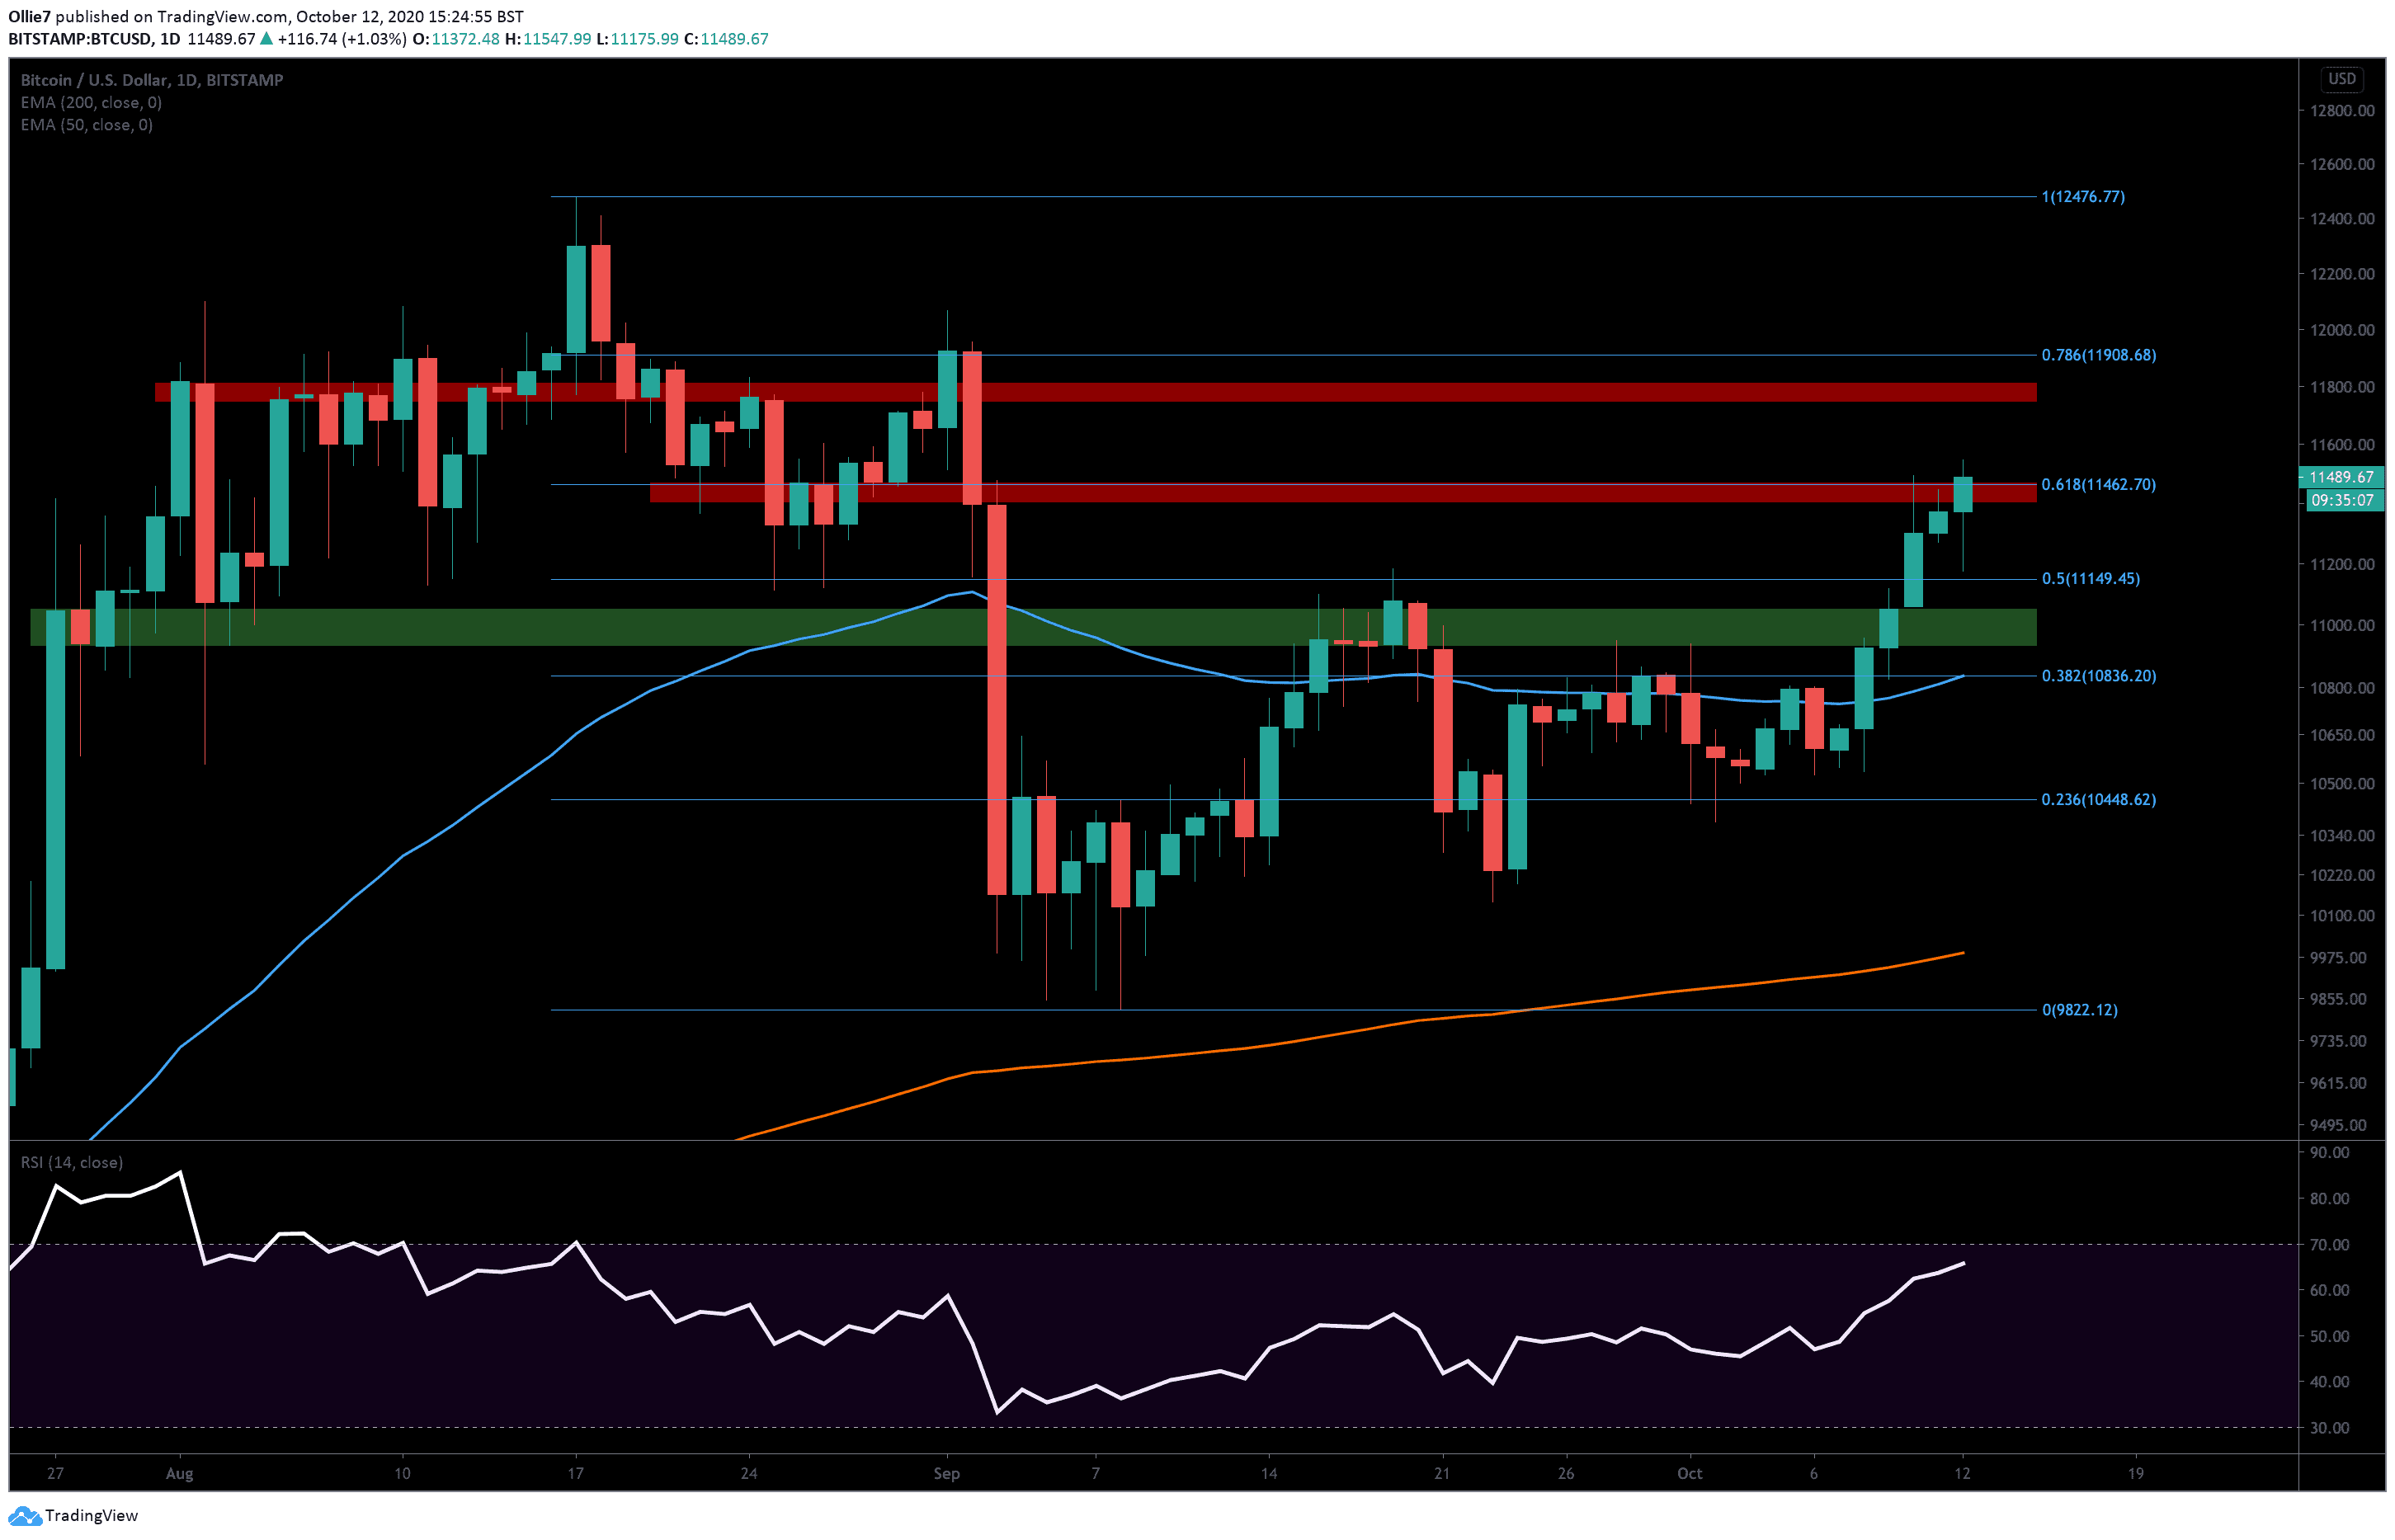
On the daily BTC/USD chart, we can see that the price is currently fraternizing with the 0.618 Fibonacci level at $11,462 (lower red shaded area). This is a critical area for BTC to hold above and will set a new 40-day daily high if bulls manage to maintain their current momentum into the close.
Looking above, the next areas of resistance will most likely be the $11,600 and the main resistance zone above between $11,750 and $11,810 (upper red shaded area). These price points have been particularly strong S/R levels over the 1-day timeframe.
Above that, we also have the 0.786 Fibonacci level at $11,908, which was the price that Bitcoin started its 16.43% decline during September 2-4. This will undoubtedly be an area of high selling pressure as BTC approaches the psychological, all-important $12,000 level and will need considerable volume to overcome.
Support-wise, there are several possible areas that should help prop up Bitcoin prices if bears take back control of the asset. The $11,245 and 0.5 Fibonacci level at $11,150 will be the first areas to observe if a downtrend begins. From there, we have the first main support zone (green shaded area), which sits around $11,000 to $10,940. This area is also reinforced by the 4-hour 50 EMA line at $11,040.
Underneath that, the 200 EMA is overlapping with the 0.382 Fibonacci level at $10,836 over the 4-hour timeframe, which should also create a solid platform for bullish traders to recover from if Bitcoin attempts to break back into its former range.
Total market capital: $369 billion
Bitcoin market capital: $212 billion
Bitcoin dominance: 57.5%
*Data by Coingecko.
Bitstamp BTC/USD Daily Chart
Bitstamp BTC/USD 4-Hour Chart

Binance Futures 50 USDT FREE Voucher: Use this link to register & get 10% off fees and 50 USDT when trading 500 USDT (limited offer).
Disclaimer: Information found on CryptoPotato is those of writers quoted. It does not represent the opinions of CryptoPotato on whether to buy, sell, or hold any investments. You are advised to conduct your own research before making any investment decisions. Use provided information at your own risk. See Disclaimer for more information.
The post appeared first on CryptoPotato


