
Over the past two days, we had seen the price of Bitcoin trading mainly under a very tight range between $8600 and $8700.
As a reminder of the recent price action, Bitcoin had gone through a decent rally since starting the new decade.
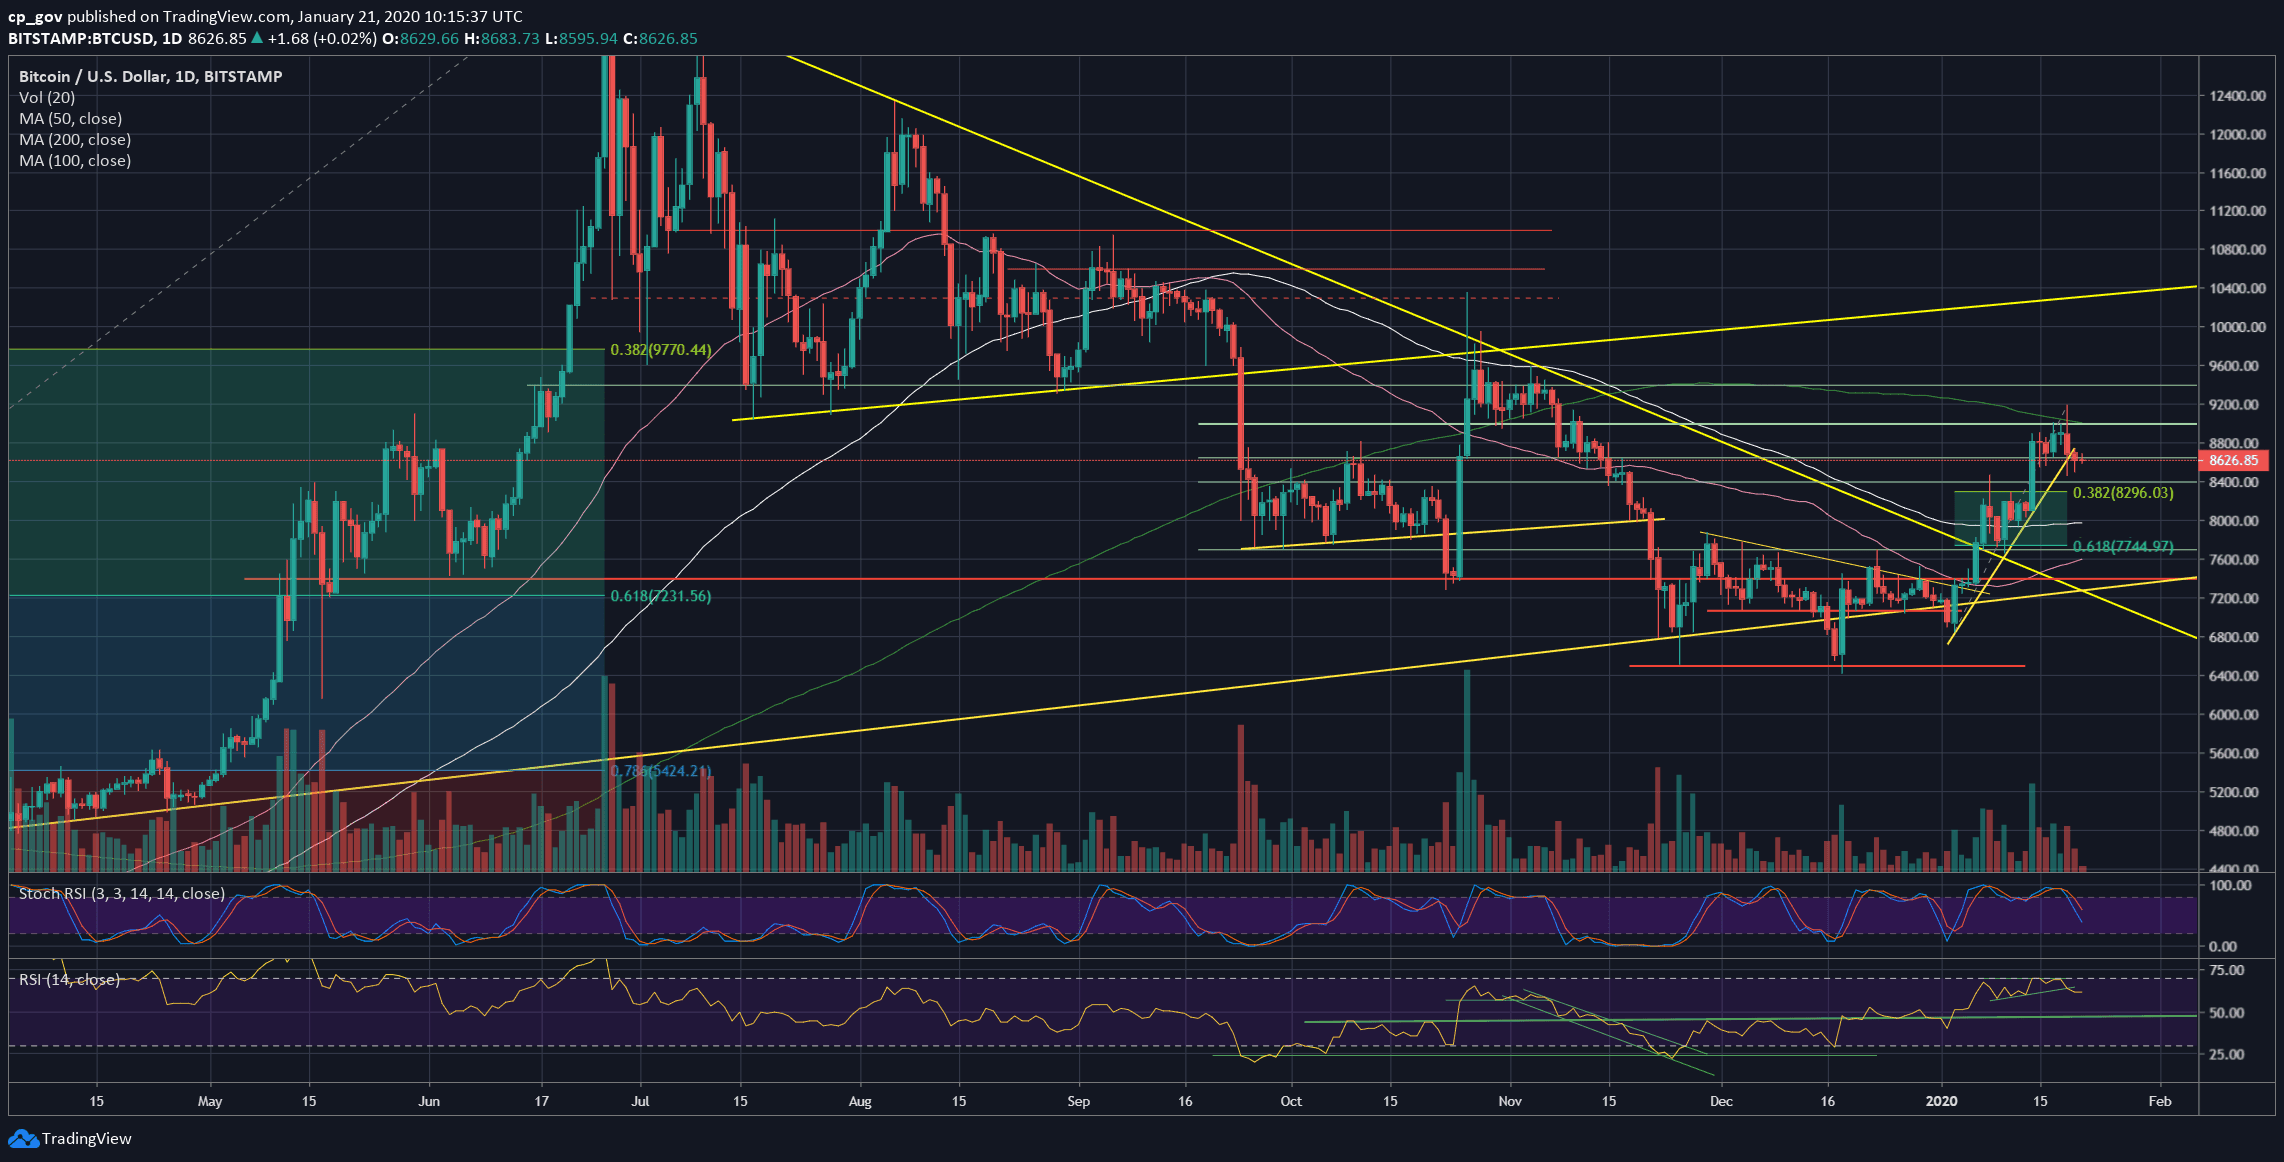
However, right after touching the significant 200-days moving average line (marked light green on the following daily chart), Bitcoin got rejected, plunged more than $700 intraday, and trading safely around the $8600 mark since then.
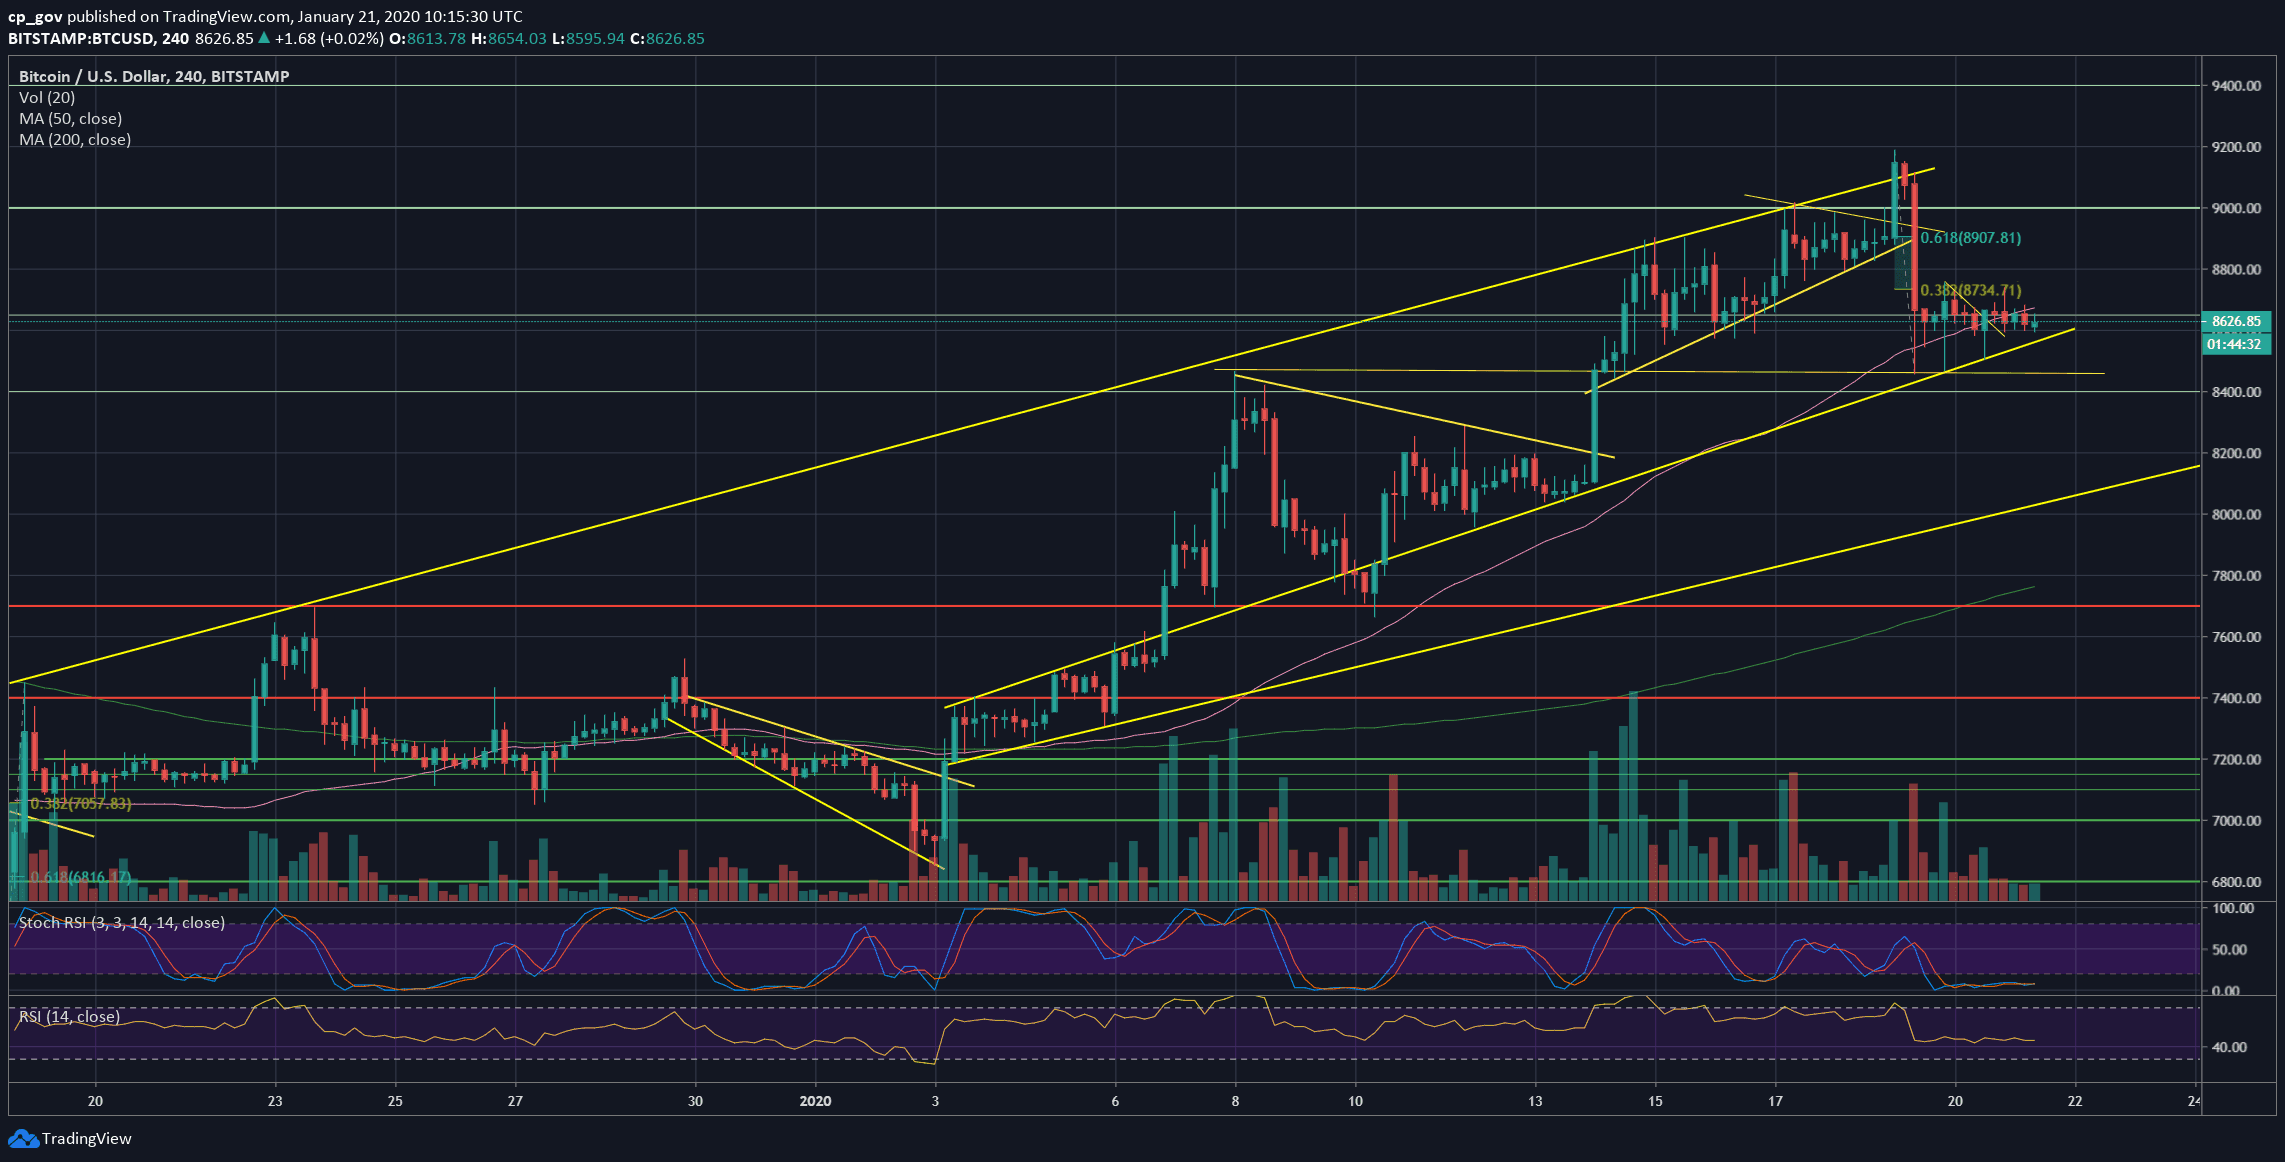
In the micro-level, we can see Bitcoin’s immediate correction reaching the 38.2% Fibonacci retracement level (~$8730) of the enormous price plunge, as can be seen on the following 4-hour chart.
Besides, the drop had reached the lower trend-line of the marked ascending channel on the 4-hour chart. Bitcoin respected that technical pattern since the beginning of the month.
Bitcoin Short-term’s Fragility
Usually, after a huge move like this, which is followed by a price consolidation period, another big move takes place. And this is precisely the situation here. Especially because Bitcoin is trading right by the lower marked trend-line.
The bulls would like to see Bitcoin finding support on top of the ascending line, and in general, not breaking the $8460 – $8600 range.
Total Market Cap: $238.7 billion
Bitcoin Market Cap: $157 billion
BTC Dominance Index: 65.8%
*Data by CoinGecko
Key Levels To Watch & Next Targets
– Support/Resistance levels: The bigger picture hadn’t changed since our previous analysis from two days ago.
The first line of support is the mentioned ascending trend-line (on the 4-hour chart). Further below is the double-bottom on the 4-hour’s chart, which is this week’s low at $8460.
A little below is the confluence zone of $8300 – $8400, along with the Fibonacci retracement level of 38.2% (of the January rise), before reaching the $8000 area, along with the 100-days moving average line (marked by white).
From above, $8730 – $8750 is still the first level of resistance Bitcoin will face (38.2% Fib level), which Bitcoin couldn’t overcome in the past two days. The next major resistance is $8900, along with the Golden Fib of 61.8%.
Further above is $9000, along with the most significant resistance at the current price area – the 200-days moving average line.
– The RSI Indicator: Following the recent price action, the RSI is showing some bearish signs, after breaking below the short-term ascending trend-line. The RSI is now facing support at 60.
The bearish momentum can also be seen in the Stochastic RSI oscillator, which is pointing lower following a crossover in the overbought territory.
– Trading volume: The recent price plunge didn’t carry a tremendous amount of volume, as compared to last month’s average volume levels. Yesterday ended with a relatively low amount of volume, maybe because of the holiday in the US.
BTC/USD BitStamp 4-Hour Chart
BTC/USD BitStamp 1-Day Chart
Disclaimer: Information found on CryptoPotato is those of writers quoted. It does not represent the opinions of CryptoPotato on whether to buy, sell, or hold any investments. You are advised to conduct your own research before making any investment decisions. Use provided information at your own risk. See Disclaimer for more information.
Cryptocurrency charts by TradingView.
Technical analysis tools by Coinigy.
The post appeared first on CryptoPotato


