
On our recent price analysis from two days ago, we had anticipated a huge price move that was supposed to be coming soon.
As can be seen, shortly after our analysis, there was the opening of the Chinese stock market after the long Lunar vacation. At the same time, Bitcoin spiked $400 to a new 2020 high over $9600 but quickly retraced.
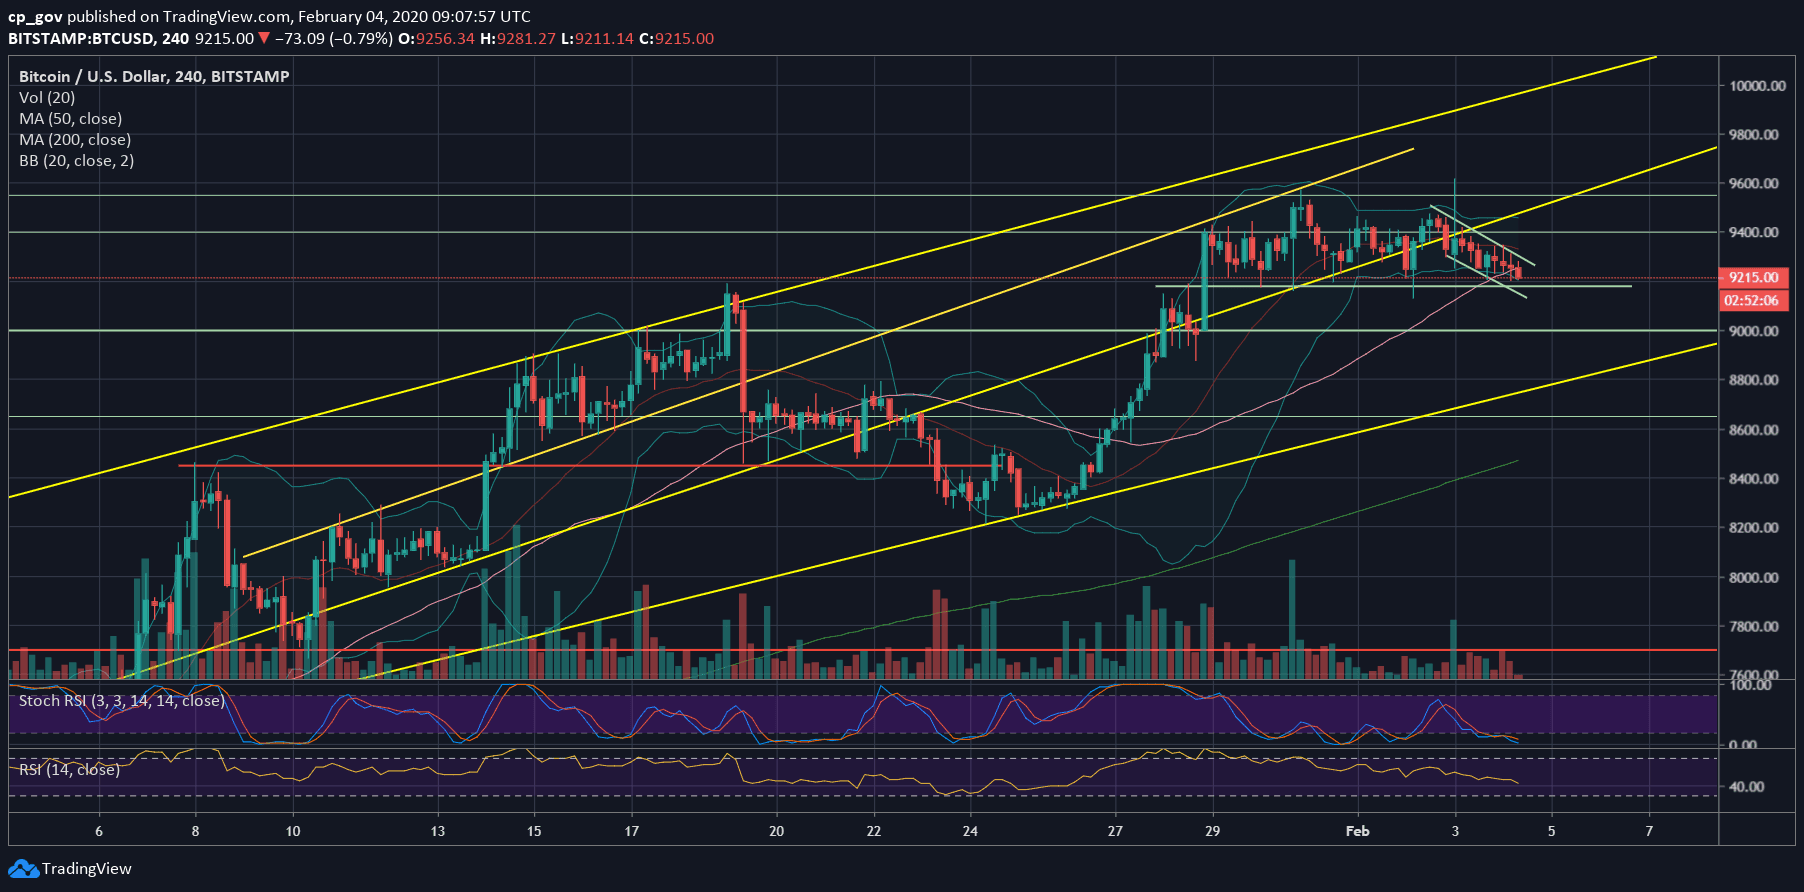
Since then, Bitcoin is slowly forming a bull-flag on the 4-hour chart. The coin is trading inside a descending channel (or flag). Keep in mind, that kind of flag tends to break to the upper side. However, there is always the chance to break to the downside as well.
Bitcoin had seen dull price action over the past days, and overall, the trading range for the past week had been mostly between $9180 to $9400, which is as little as a 2% trading range. Quite stable and very odd for Bitcoin, compared to the current volatility of the stock markets, and Tesla in particular.
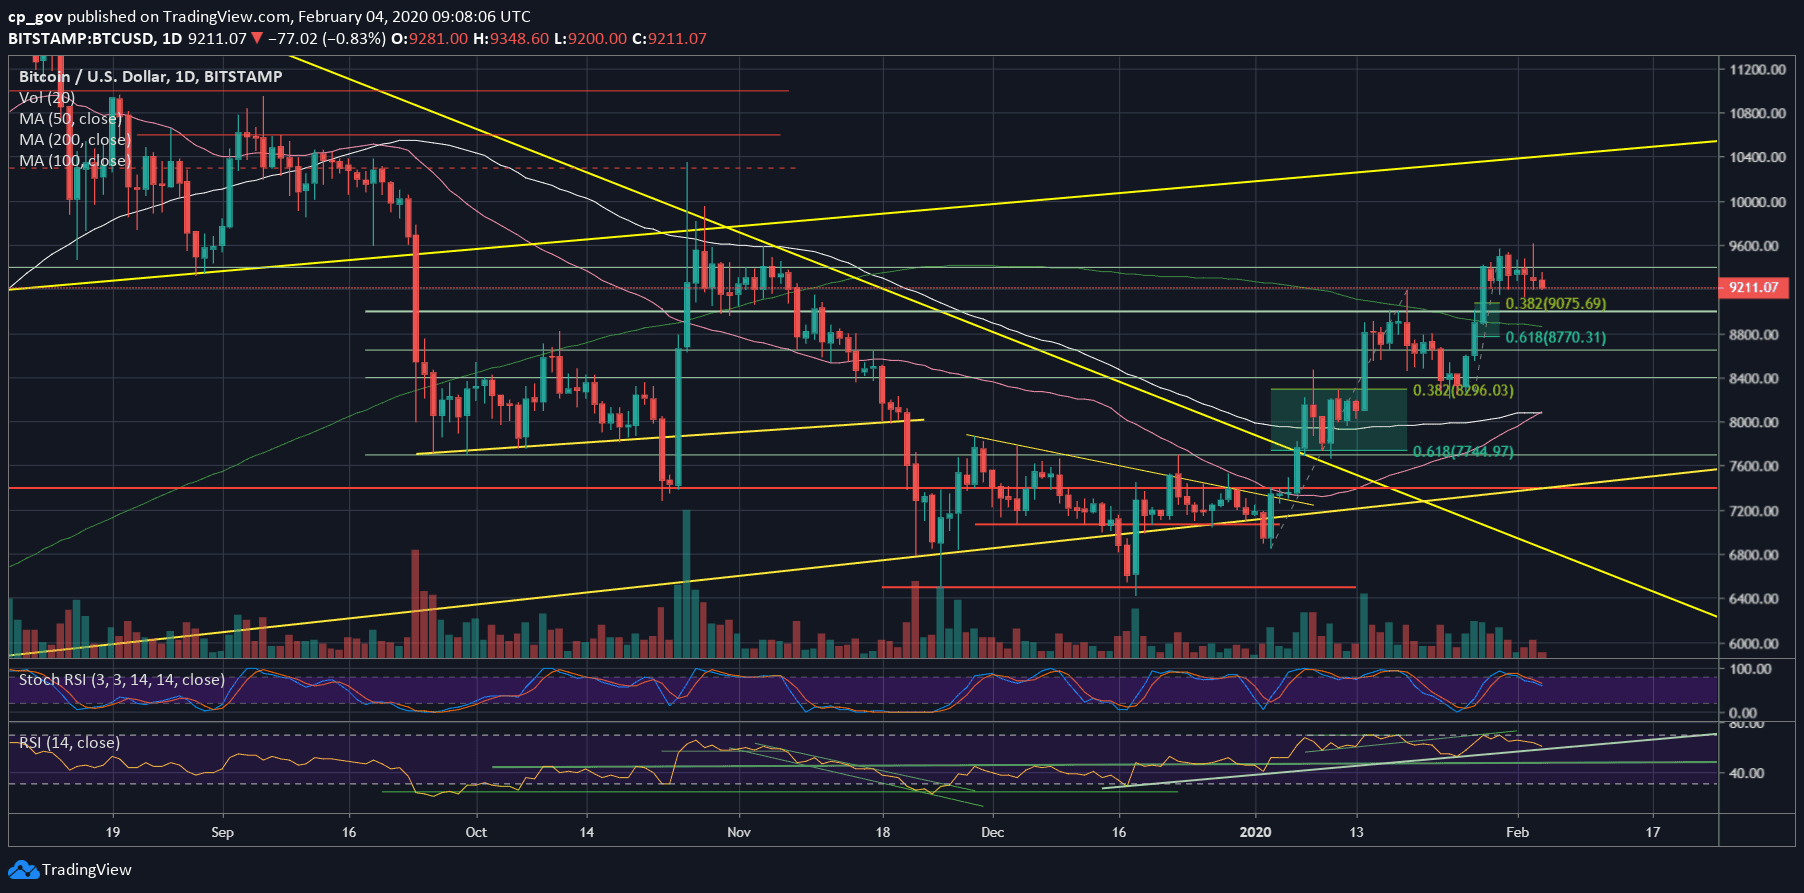
The Golden cross: As we can see on the following daily chart, Bitcoin is having a mini Golden cross, as the 50-days moving average line (pink) crosses above the 100-days line (white). As mentioned here before, the real and more serious cross involved the 50 and the 200 MA (light green) lines. However, some analysts also give some respect to this 50 on 100 Golden cross.
Total Market Cap: $258.5 billion
Bitcoin Market Cap: $168 billion
BTC Dominance Index: 65.2%
*Data by CoinGecko
Key Levels To Watch & Next Possible Targets
– Support/Resistance levels: Bitcoin is now testing the MA-50 supporting line on the 4-hour chart, along with the $9180 – $9200 resistance turned support level. In general, the coin’s short-term is dependent on the bull-flag on the 4-hour chart. A breakout will likely lead to the next price move’s direction.
Below $9180, the next level of support is at $9075, which is the 38.2% Fibonacci retracement level of the recent bullish move.
Further below lies $9000 and $8900, along with the significant 200-days moving average line. The next level is the Golden Fib level – 61.8% – at $8770.
From the bullish side, the first level of resistance is now the upper angle of the flag, roughly around $9300. Further above lies the $9450 area (a recent high) before the 2020 high at $9550 – $9600.
– The RSI Indicator: As mentioned here on the previous analysis, there was more room to go down on behalf of the RSI indicator. As of now, the indicator is getting very close to a crucial ascending trend-line support (~60 RSI levels).
– Trading volume: After a week of declining volume, finally, the volume started to accumulate once again. For the past three days, the volume is rising; however, these are still relatively low volume candles.
BTC/USD BitStamp 4-Hour Chart
BTC/USD BitStamp 1-Day Chart
Disclaimer: Information found on CryptoPotato is those of writers quoted. It does not represent the opinions of CryptoPotato on whether to buy, sell, or hold any investments. You are advised to conduct your own research before making any investment decisions. Use provided information at your own risk. See Disclaimer for more information.
The post appeared first on CryptoPotato


