
Bitcoin was a down-trend road for the past two weeks, and this is no secret. Yesterday the lowest price since May 2019 was reached once again – roughly around $6500.
Once it was reached, it completed a 10-days decline of $1100 or 15%. That was the right place to ask – “Is it a time for a correction,” which was the title of yesterday’s Bitcoin analysis.
A few hours later, the (maybe temporary) bottom was marked once again around $6500 and once again, we saw a quick correction back above. The first time Bitcoin reached $6500 it then reached $7900 after four days.
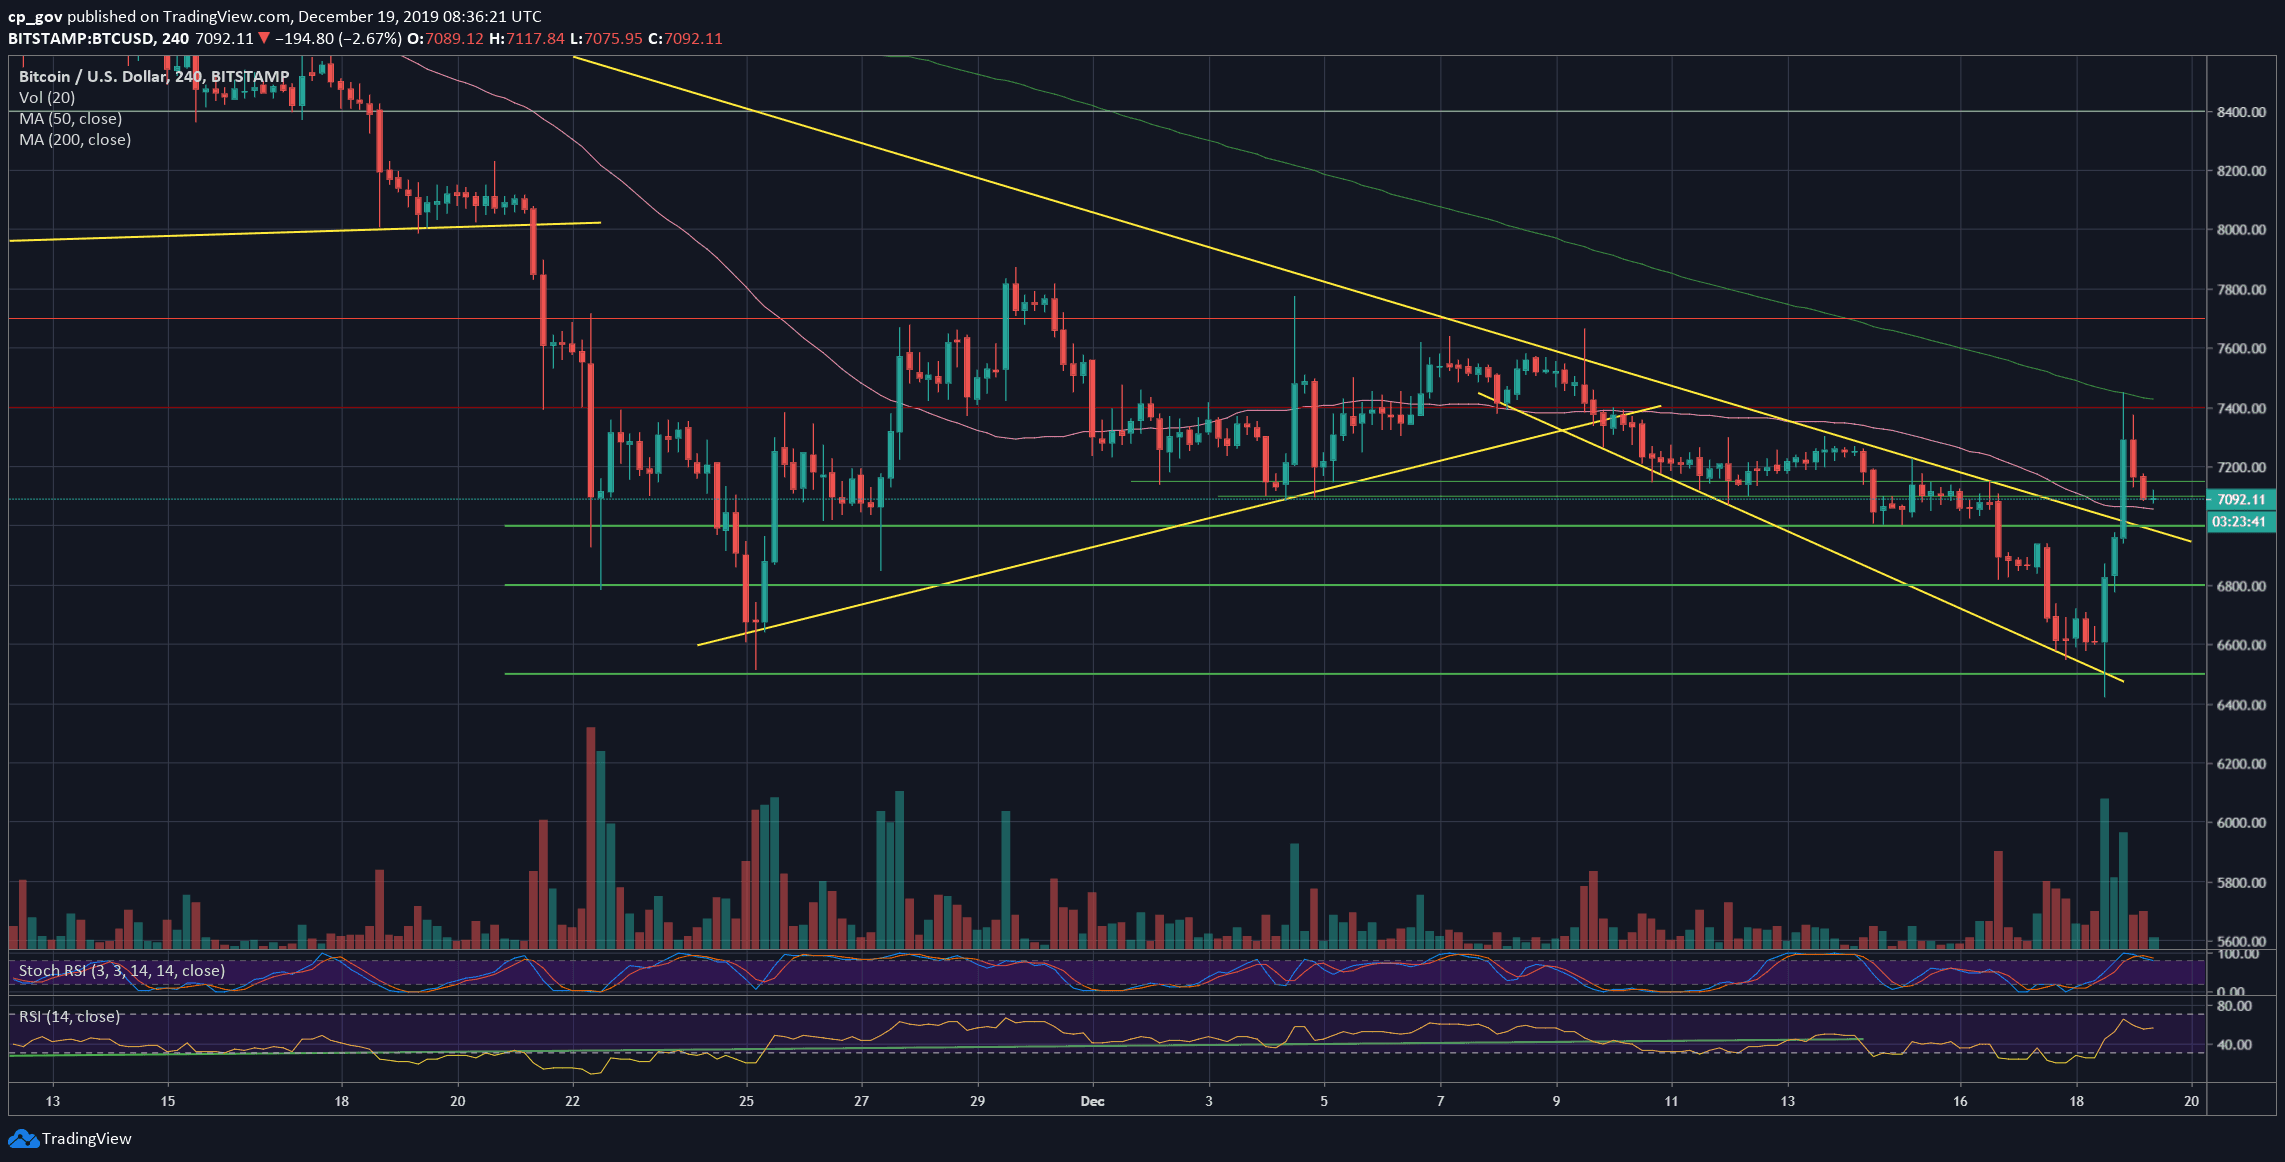
As mentioned here yesterday, the targets for a possible correction was the $7300 – $7400 area. As can be seen on the chart below, this morning, Bitcoin reached a peak at $7449 (Bitstamp). $7400 is also the significant 78.6% Fibonacci retracement level of the recent 10-days’ drop.
Besides, part of my bullish prediction was achieved: “The only bullish possibility is in case this setting turns into a double-bottom or a “W” shape pattern, where Bitcoin would have to break above the $7700 resistance line to return bullish.”
The second part, breaking above $7700, is the left question which is left unknown: Bitcoin is not yet back to the safe-zone, since once the coin reached the $7300 – $7400, it got quickly rejected. As of writing this update, Bitcoin is trading at $7100.
Total Market Cap: $187 billion
Bitcoin Market Cap: $128 billion
BTC Dominance Index: 68.3%
*Data by CoinGecko
Key Levels to Watch
– Support/Resistance: After getting rejected at the $7300 – $7400 zone, this has officially become the first obstacle-resistance for Bitcoin on its way back up.
In case of a breakout, then the next significant level lies at $7700, before the good-old $8000 resistance.
From below, the current price area of $7000 – $7100 is the first level of support. Further below lies $6800, and $6500 – $6600, which is the low from yesterday, as well as the lowest price since May 17, 2019.
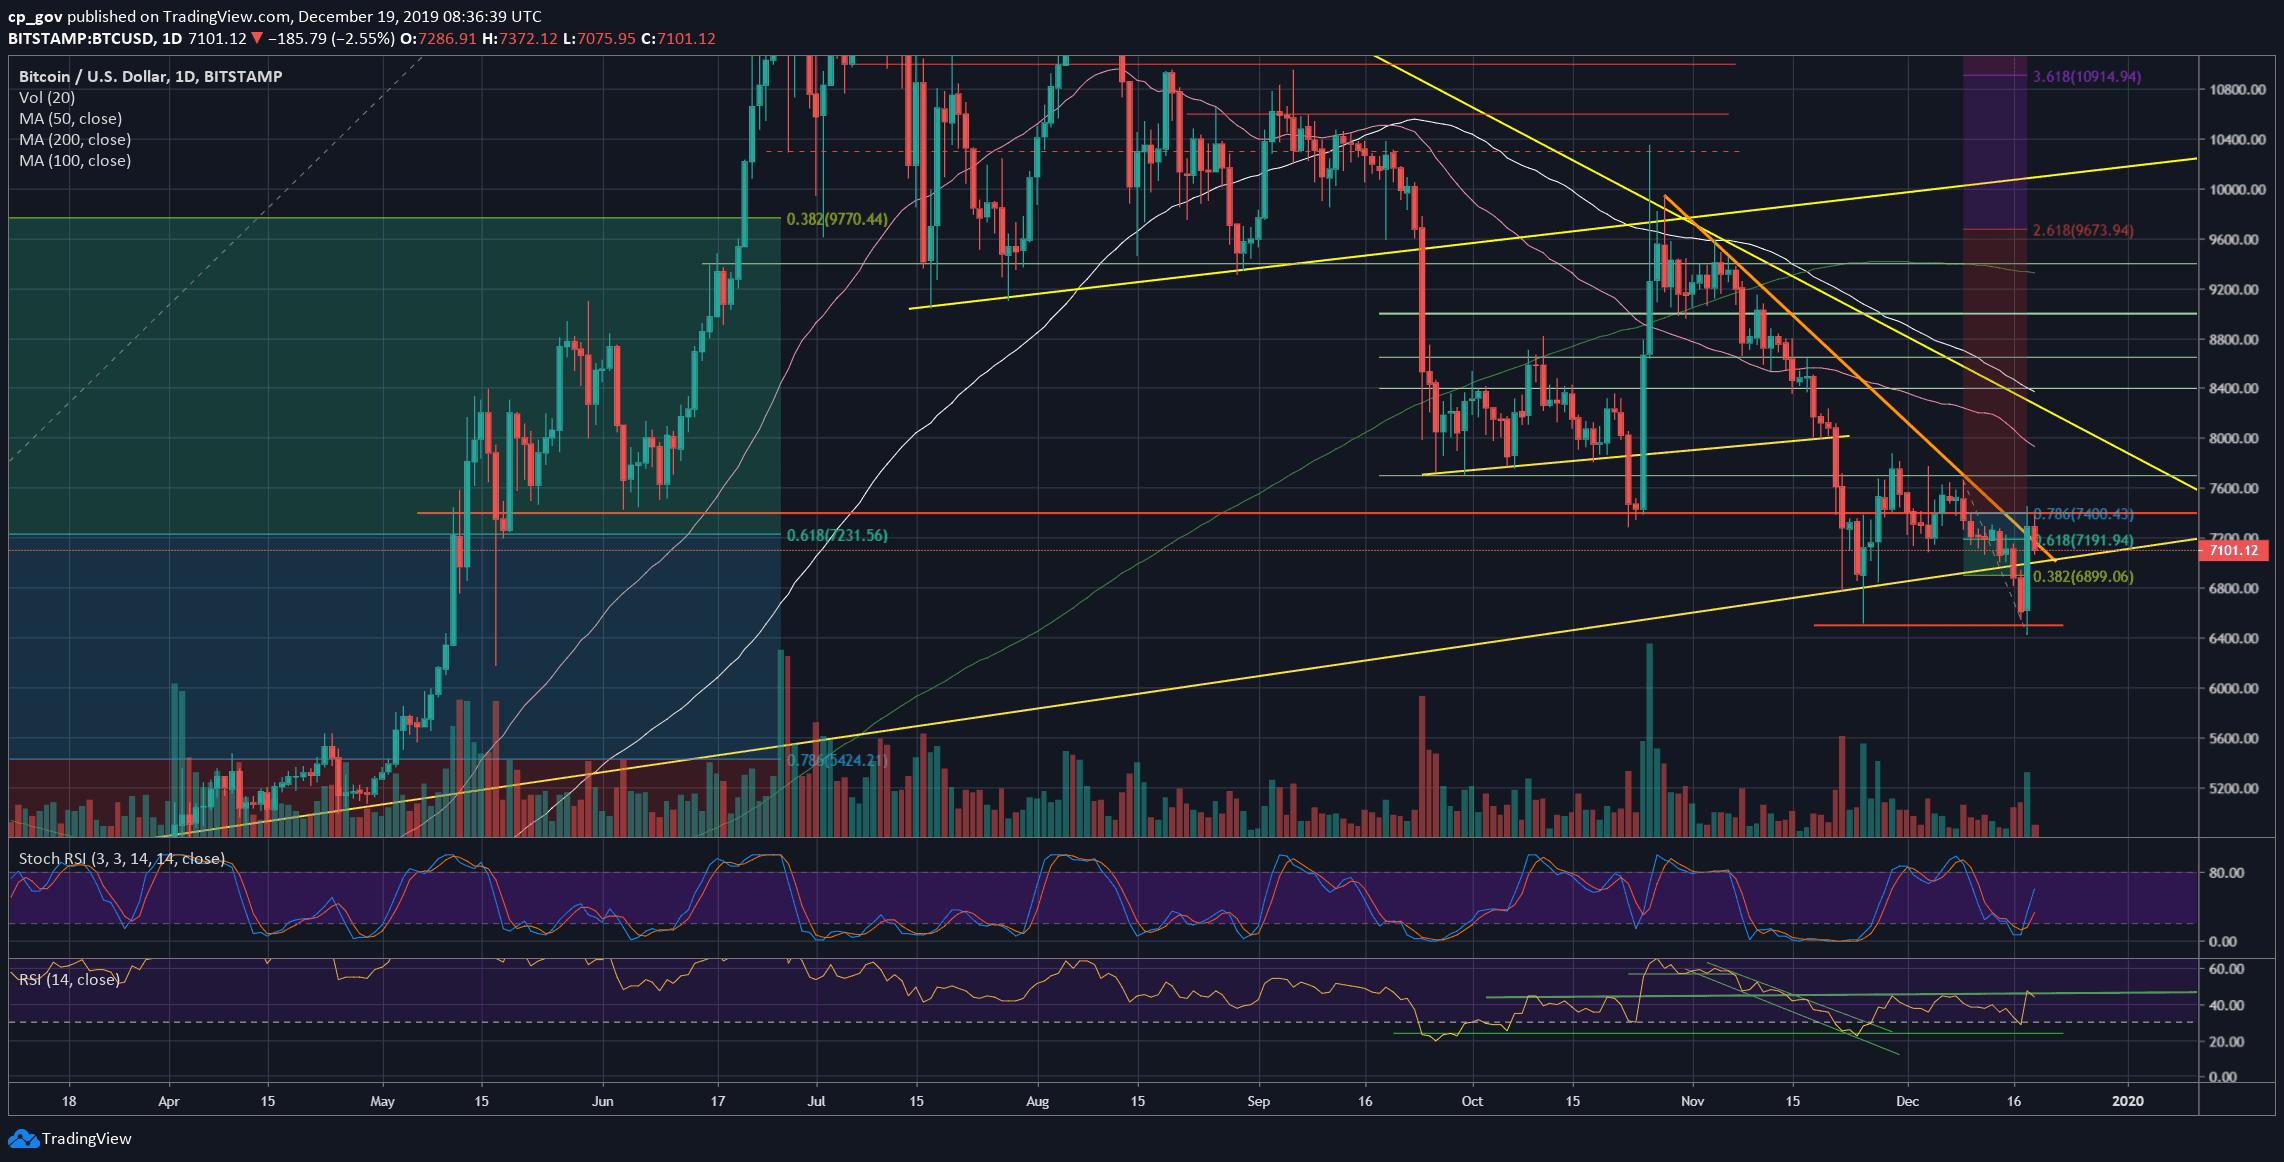
In case of a breakdown from here, then $6300 might be the next possible target. Further down is $6100 and $6000. If we zoom out a bit, we can start seeing $5400 as a potential longer-term target. The last is the 78.6% Fibonacci retracement level of the 2019 first half bullish move (up to $13,880 in June).
– The RSI Indicator: Like a textbook: Once the RSI encountered the crucial 30 support level, it turned around bullish, and quickly reached the 45 area, which is the marked ascending trend-line on the daily chart. Bitcoin couldn’t resist, and found a top there, as of writing this.
Stochastic RSI oscillator proved once again that it’s one of the most trusted technical indicators out there: A classic bullish cross at the oversold territory took place yesterday, while Bitcoin was only starting its price explosion.
– Trading volume: The reversal day of yesterday translated to a massive amount of volume. Yesterday’s volume candle was the highest since November 25. This is a bullish sign.
BTC/USD BitStamp 4-Hour Chart
BTC/USD BitStamp 1-Day Chart
Disclaimer: Information found on CryptoPotato is those of writers quoted. It does not represent the opinions of CryptoPotato on whether to buy, sell, or hold any investments. You are advised to conduct your own research before making any investment decisions. Use provided information at your own risk. See Disclaimer for more information.
Cryptocurrency charts by TradingView.
Technical analysis tools by Coinigy.
You might also like:
The post appeared first on CryptoPotato


