
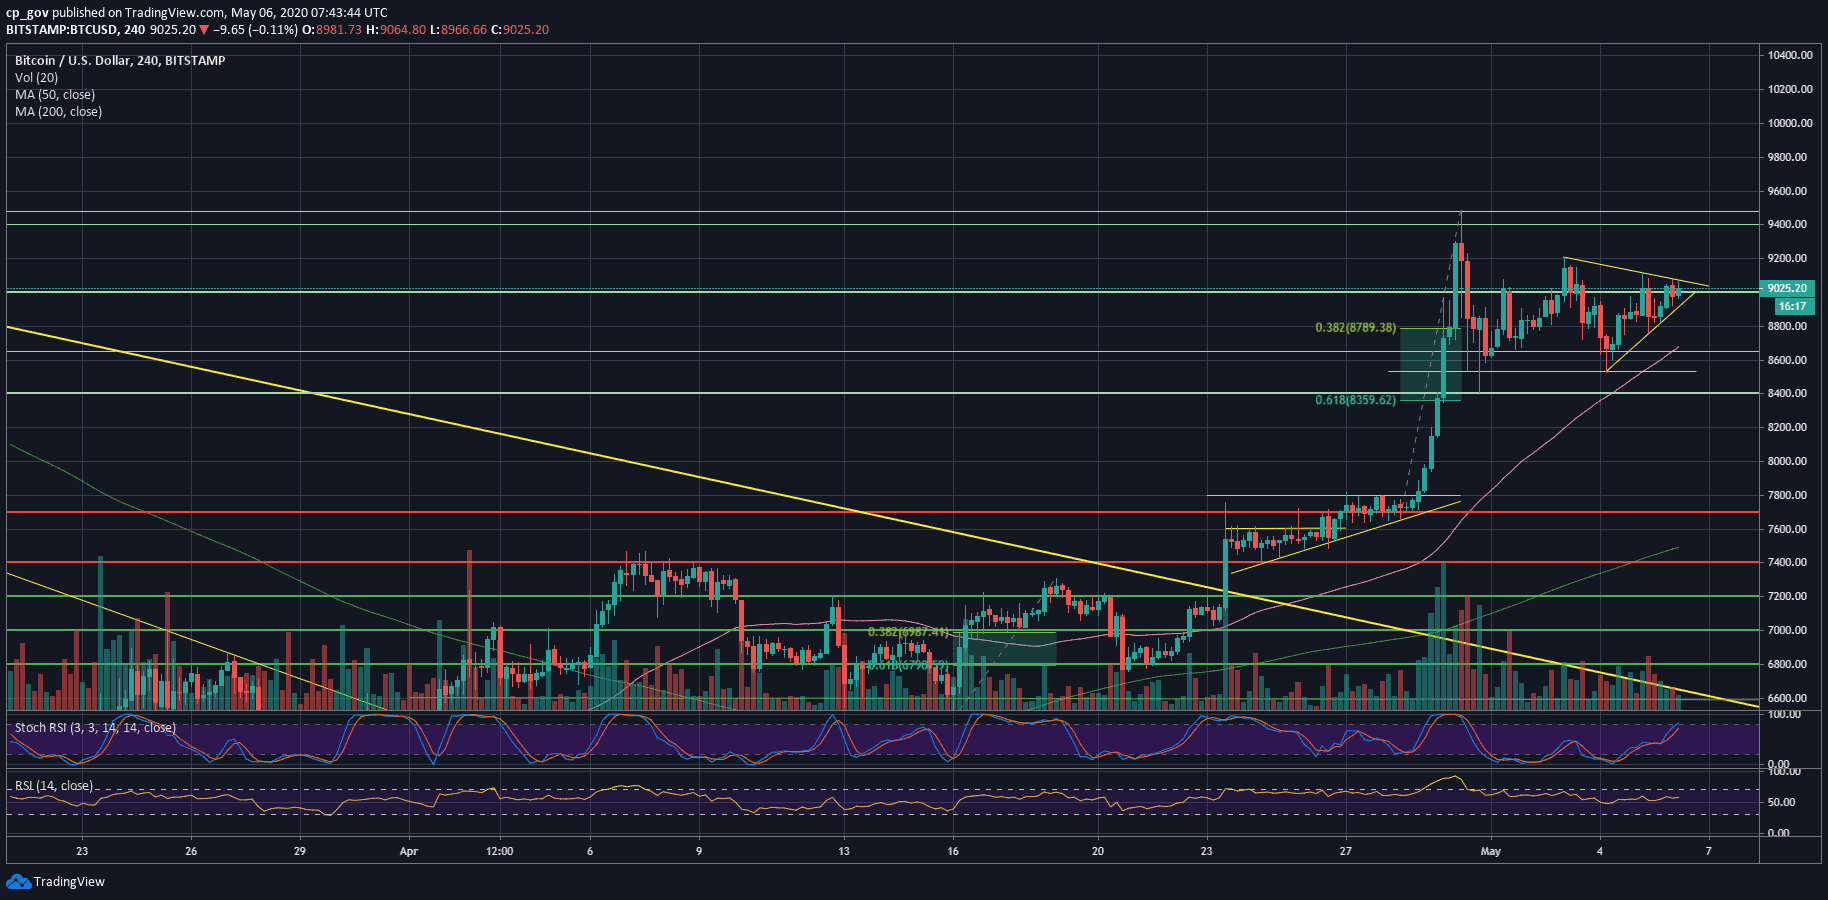
Over the past two days, Bitcoin price seems to be consolidated in a triangle pattern, as can be seen below on the following shorter timeframe chart (the 4-hour).
The symmetrical triangle consolidates around the $9000 benchmark, where its apex is anticipated somewhere in the next day. However, as we learned before, Bitcoin might break of the pattern even before reaching the apex.
Overall, there is an ongoing ‘fight’ between the buyers and the sellers that will get even more exciting as we are only six days away from the Bitcoin halving event.
When looking at the trading volume, we can see three consecutive low-volume days, supporting the idea that the next big price move is around the corner.
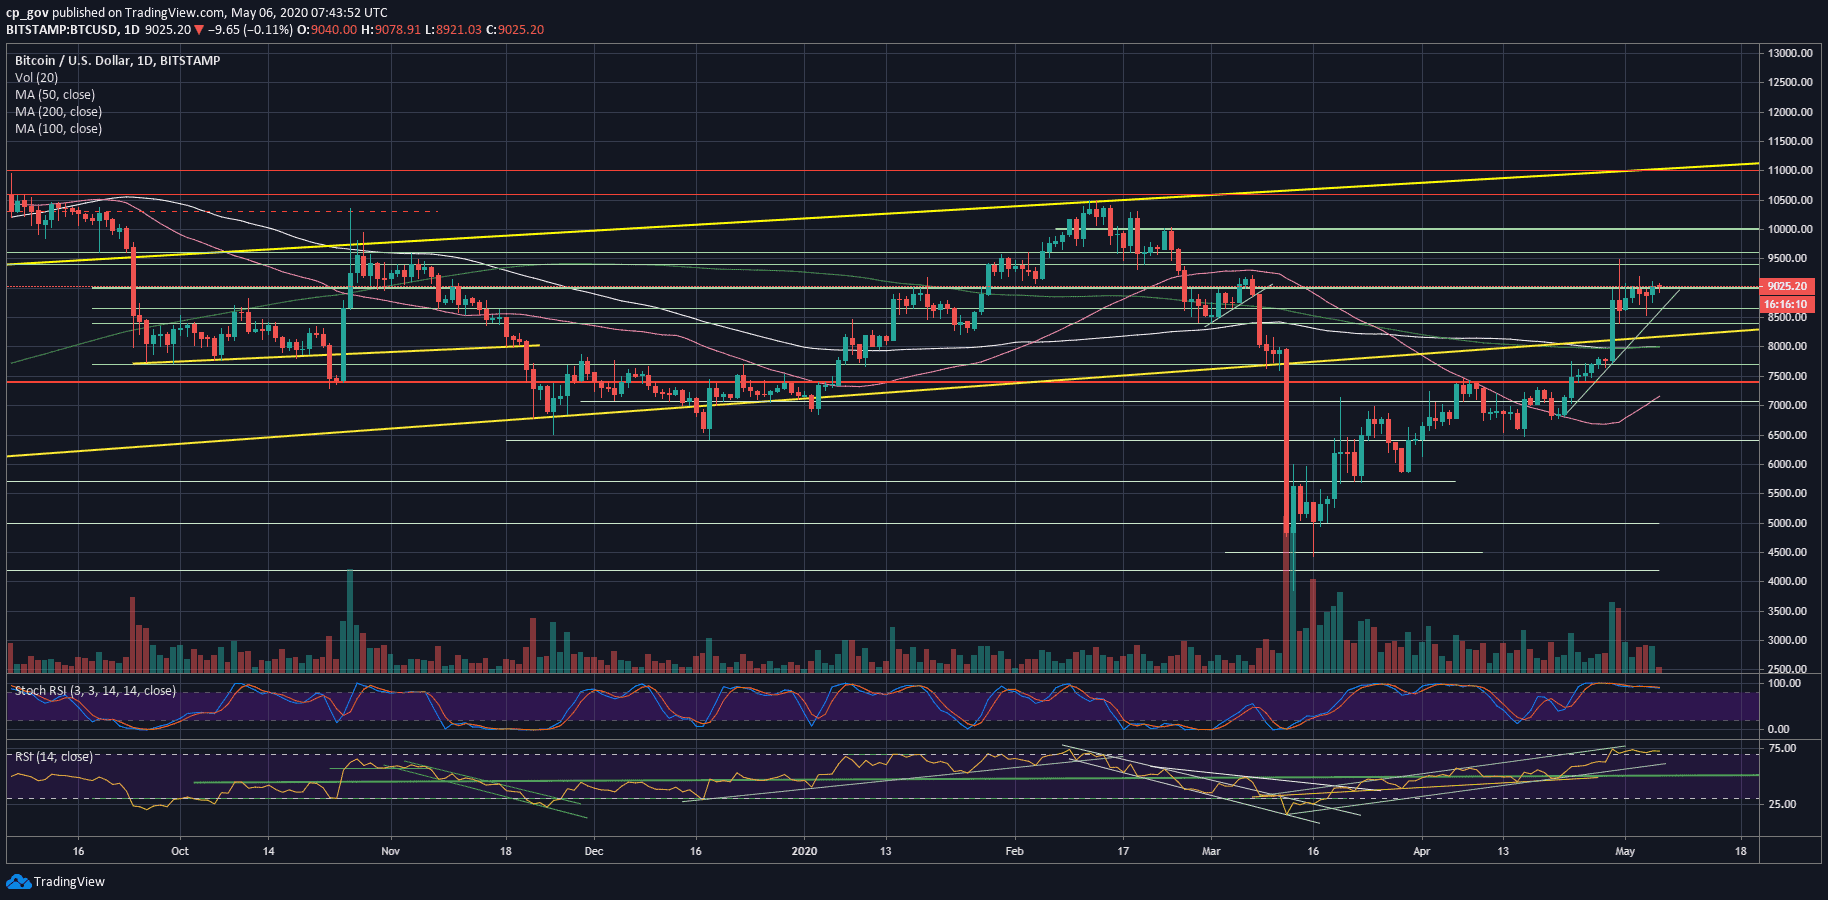
Looking at the bigger timeframe, the weekly chart: as been written here two days ago, Bitcoin will seek to maintain a weekly close above the crucial level of $8400, which falls precisely at the long-term ascending trend-line. A line that was started forming in January 2015.
Total Market Cap: $251 billion
Bitcoin Market Cap: $165 billion
BTC Dominance Index: 66.1%
*Data by CoinGecko
Key Levels To Watch & Next Possible Targets
– Support/Resistance levels: As of writing these lines, while waiting for a breakout, Bitcoin is struggling around the confluence level of $9000, along with the triangle’s upper angle.
In case of a break-up, the next resistance lies at $9200, which is the high from Sunday. Further above lies $9400 – $9500, which is the highest level since February, and the peak from a week ago.
This is followed by resistance at $9800 – $10,000, which is the most crucial price area for the Bitcoin bulls’ short-term.
From below, besides the triangle’s lower angle, the first level of support now lies at $8800. In case Bitcoin breaks down, the next level will possibly be $8650, $8530, and $8400 (the critical weekly support). Below lies $8200 and $8000.
– The RSI Indicator: Along with the recent price action, the RSI is consolidating above 70, and looks more bullish than bearish.
– Trading volume: Discussed above.
BTC/USD BitStamp 4-Hour Chart
BTC/USD BitStamp 1-Day Chart
The post Bitcoin Price Analysis: The Triangle Formation Can Send BTC To $10K Or $8K, Breakout Soon? appeared first on CryptoPotato.
The post appeared first on CryptoPotato


