
Bitcoin likes to do things fast: Following yesterday’s analysis, we see that 2020 is so far very bullish for Bitcoin.
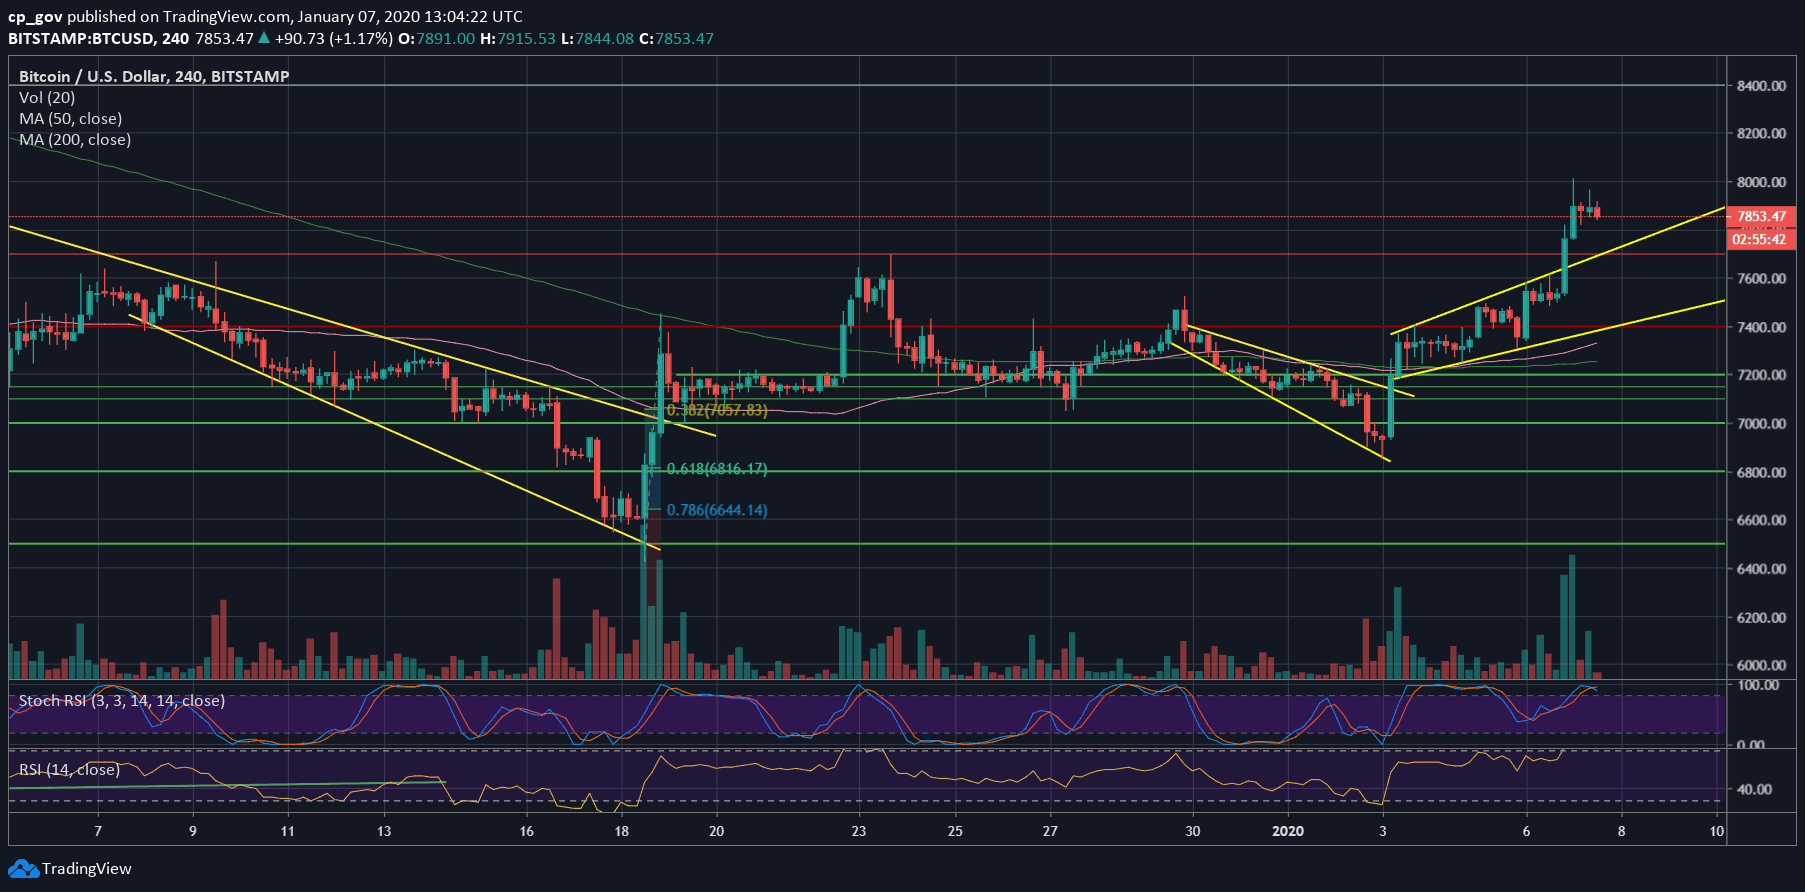
In less than seven days, Bitcoin had seen over a 10% increase. Yesterday, we pointed out the ascending channel on the 4-hour chart. Today, Bitcoin had broken up from the channel and quickly reached into the confluence zone at $7700- $7800.
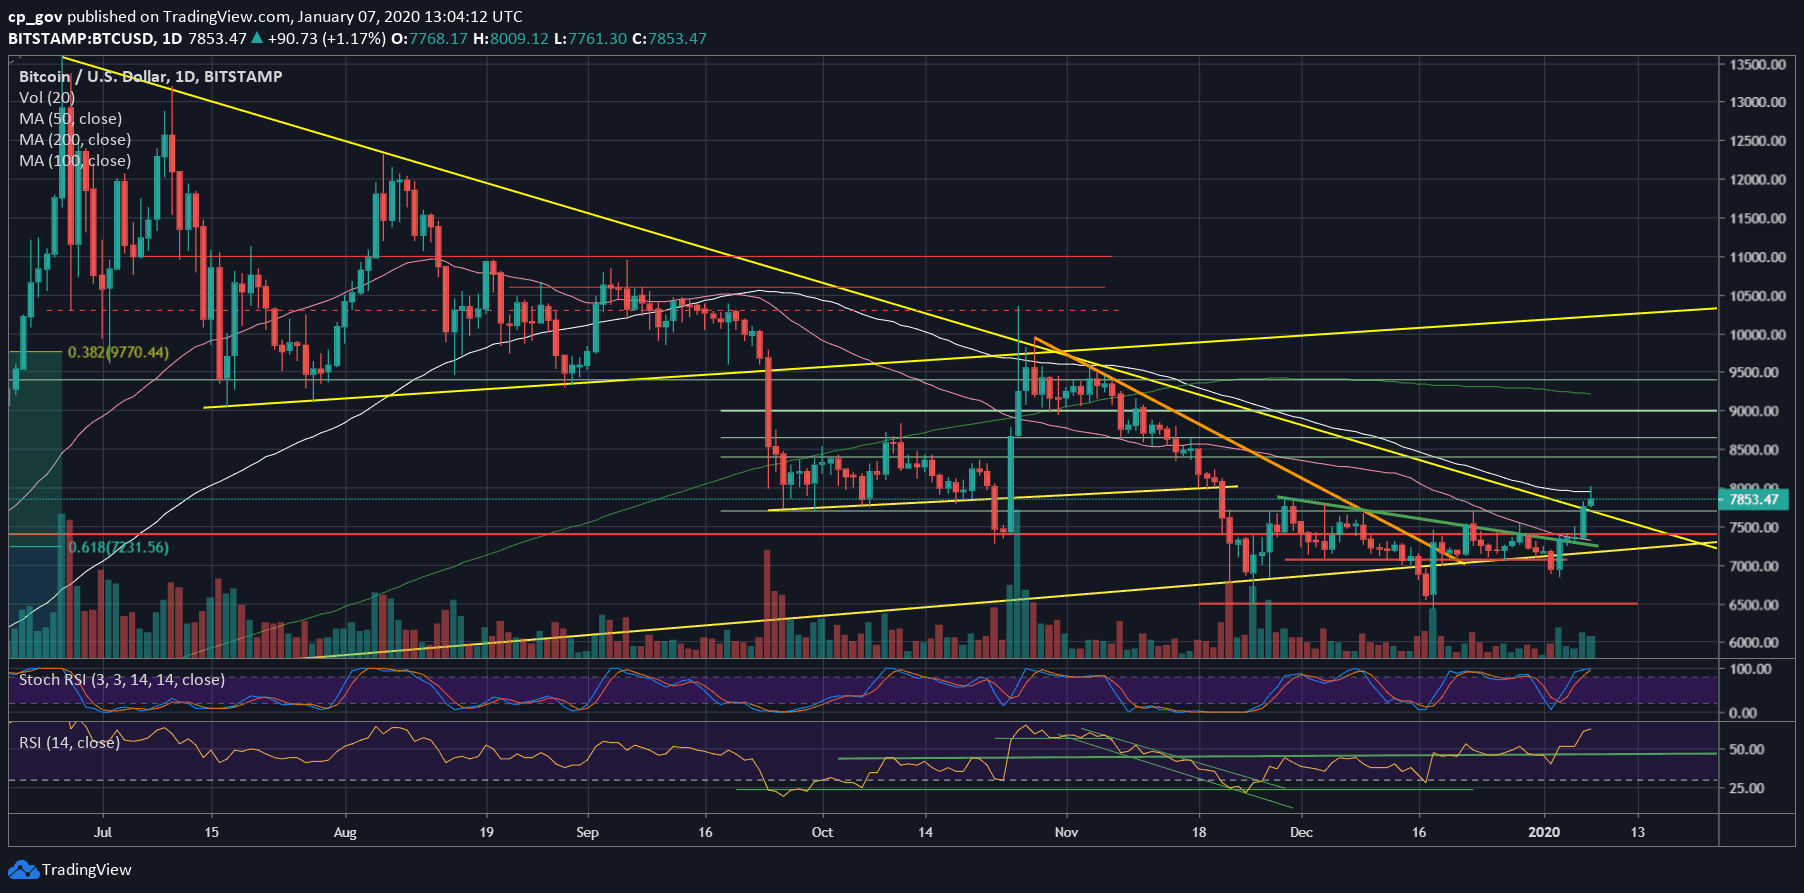
Bitcoin had done more than that: Looking on the daily chart, Bitcoin nicely broke out of the most significant trend-line of 2019, the one that was started forming during the second half of June, while Bitcoin’s 2019 high was reached.
It doesn’t mean that the mission is accomplished, since Bitcoin will have to hold those levels (and not end-up as a fake-out), but it’s still very impressive. As we already know in crypto, the trend can change at any moment, but so far, this looks promising.
Total Market Cap: $210 billion
Bitcoin Market Cap: $143.5 billion
BTC Dominance Index: 68.2%
*Data by CoinGecko
Key Levels To Watch & Next Targets
– Support/Resistance levels: Bitcoin is now facing the critical $8000 benchmark level, along with the 100-days moving average line (marked white). From above, the next resistance levels lie at $8300, $8400, and $8650.
A further target is the $9000 and the crucial 200-days moving average line (marked light green), currently around $9250.
Following the recent days’ gains, I’m not expecting Bitcoin to break $8000 so quickly. From below, in case of a correction, the first level of support is $7700, along with the CME futures’ gap (around $7680). The next major support lies at the resistance turned support zone of $7300 – $7400. Further below is $7200.
– The RSI Indicator: Nice and bullish, the momentum indicator continues its way up. This is the highest level of the RSI indicator since the end of October.
The Stochastic RSI oscillator is about to make a cross-over at the overbought area. This might trigger a healthy correction following the gains.
– Trading volume: Slowly, the volume is starting to show up. Those are still not the volume levels we expect for a trend change; however, the volume is slowly rising in favor of the bulls.
BTC/USD BitStamp 4-Hour Chart
BTC/USD BitStamp 1-Day Chart
Disclaimer: Information found on CryptoPotato is those of writers quoted. It does not represent the opinions of CryptoPotato on whether to buy, sell, or hold any investments. You are advised to conduct your own research before making any investment decisions. Use provided information at your own risk. See Disclaimer for more information.
Cryptocurrency charts by TradingView.
Technical analysis tools by Coinigy.
You might also like:
The post appeared first on CryptoPotato


