
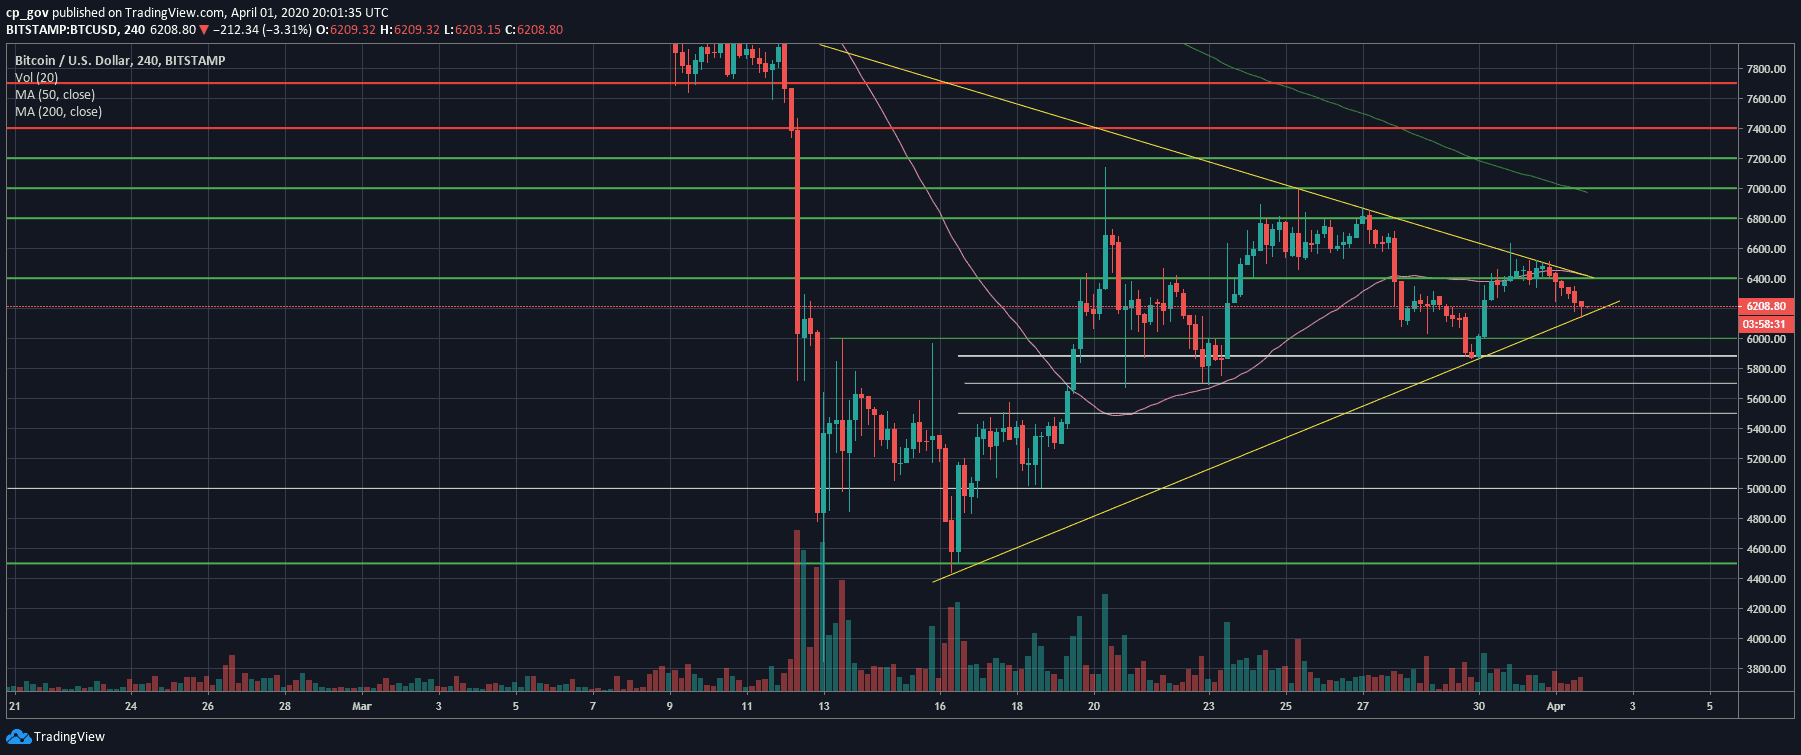
Over the past two days, we saw Bitcoin losing momentum following the global markets. After reaching the $6600 resistance, Bitcoin price failed to break the symmetrical triangle as can be seen on the following 4-hour chart.
From there, Bitcoin found temporary support upon the $6400 boundary, before continuing the 3-day plunge to the lower angle of the triangle. As of writing these lines, the lower ascending trend-line holds. The critical support lies around $6130 (Bitstamp), which is also the daily low.
The past month was devastating for almost all assets. While Wall Street’s leading indices are down 30% from their all-time high reached mid-February, Bitcoin lost over 40% from its 2020 high reached mid-February as well.
Last week Bitcoin was trading steadily above the $6K mark. As of now, in case Bitcoin won’t hold the mentioned support line, it could quickly develop into a deeper plunge to the $5K area once again.
Total Market Cap: $175.6 billion
Bitcoin Market Cap: $113.7 billion
BTC Dominance Index: 64.8%
*Data by CoinGecko
Key Levels To Watch & Next Possible Targets
– Support/Resistance levels: After breaking down the $6300 – $6400 price range (together with the 4-hour MA-50 pink line), Bitcoin is now facing the crucial support around the $6100 area, along with the lower ascending angle of the 4-hour’s triangle.
In case of a breakdown, we can expect the next support line to be found at $5880 – $5900. Further down lies $5700 and $5500, before the $5200 – $5300 price zone.
In case of a correction, the first resistance level from above now lies at $6200, followed by the $6300 – $6400 support turned resistance strip. Above lies the prior high at $6600.
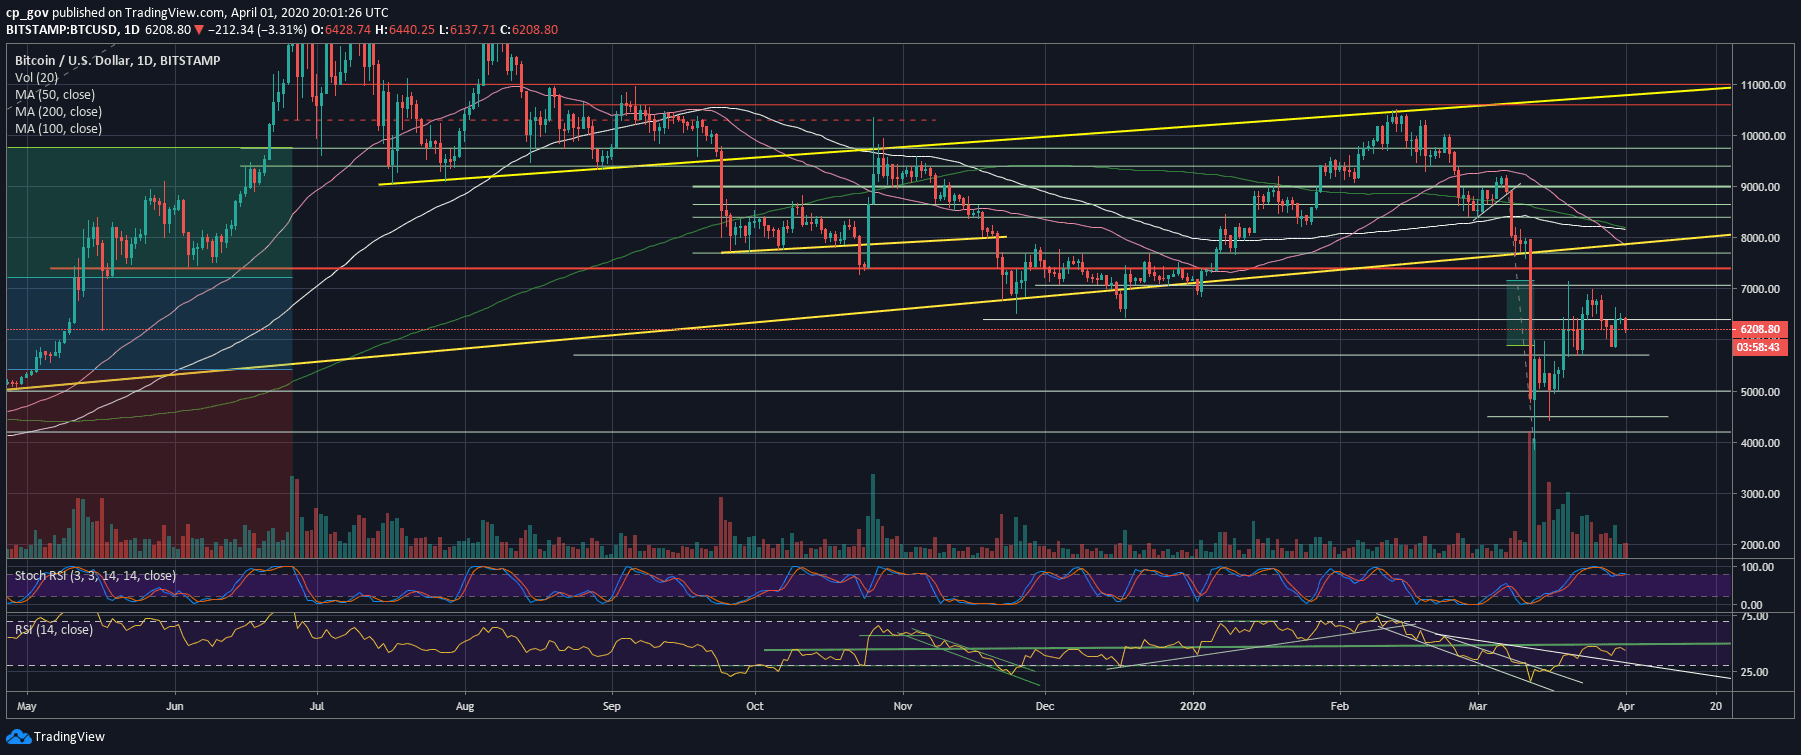
– The RSI Indicator: The RSI encountered the crucial resistance at 48 – 50 and became bearish quickly. As of now, the RSI is facing down, and more than that, the Stochastic RSI oscillator is about to enter the neutral area after a bearish crossover at the overbought territory. This might lead to even further drop.
– Trading volume: Despite the action, the volume levels had been declining since mid-February. Bitcoin is waiting for the next move to take place, not mentioning the next move might have started today, April 1st.
BTC/USD BitStamp 4-Hour Chart
BTC/USD BitStamp 1-Day Chart
The post Bitcoin Price Analysis: Will The Crucial Resistance Save Bitcoin Before Price Plunge To $5,000? appeared first on CryptoPotato.
The post appeared first on CryptoPotato


