
Bitcoin’s price has finally broken above the $10,580 range high and is now surging towards the psychological $11,000 mark.
The increase appears to have been caused by an influx of $12 billion flooding into the crypto market during the US trading session. This uptick in investment has helped lift the entire market back into the green and drive BTC prices above the 4-hour 50 and 200 EMA lines.
While this seems pretty positive right now, we could see a temporary correction soon if BTC breaks into the overbought region on the 4H RSI, and it’s unclear at this point if this pump is a genuine uptrend or the start of yet another whale shakeout.
Price Levels to Watch in the Short-term
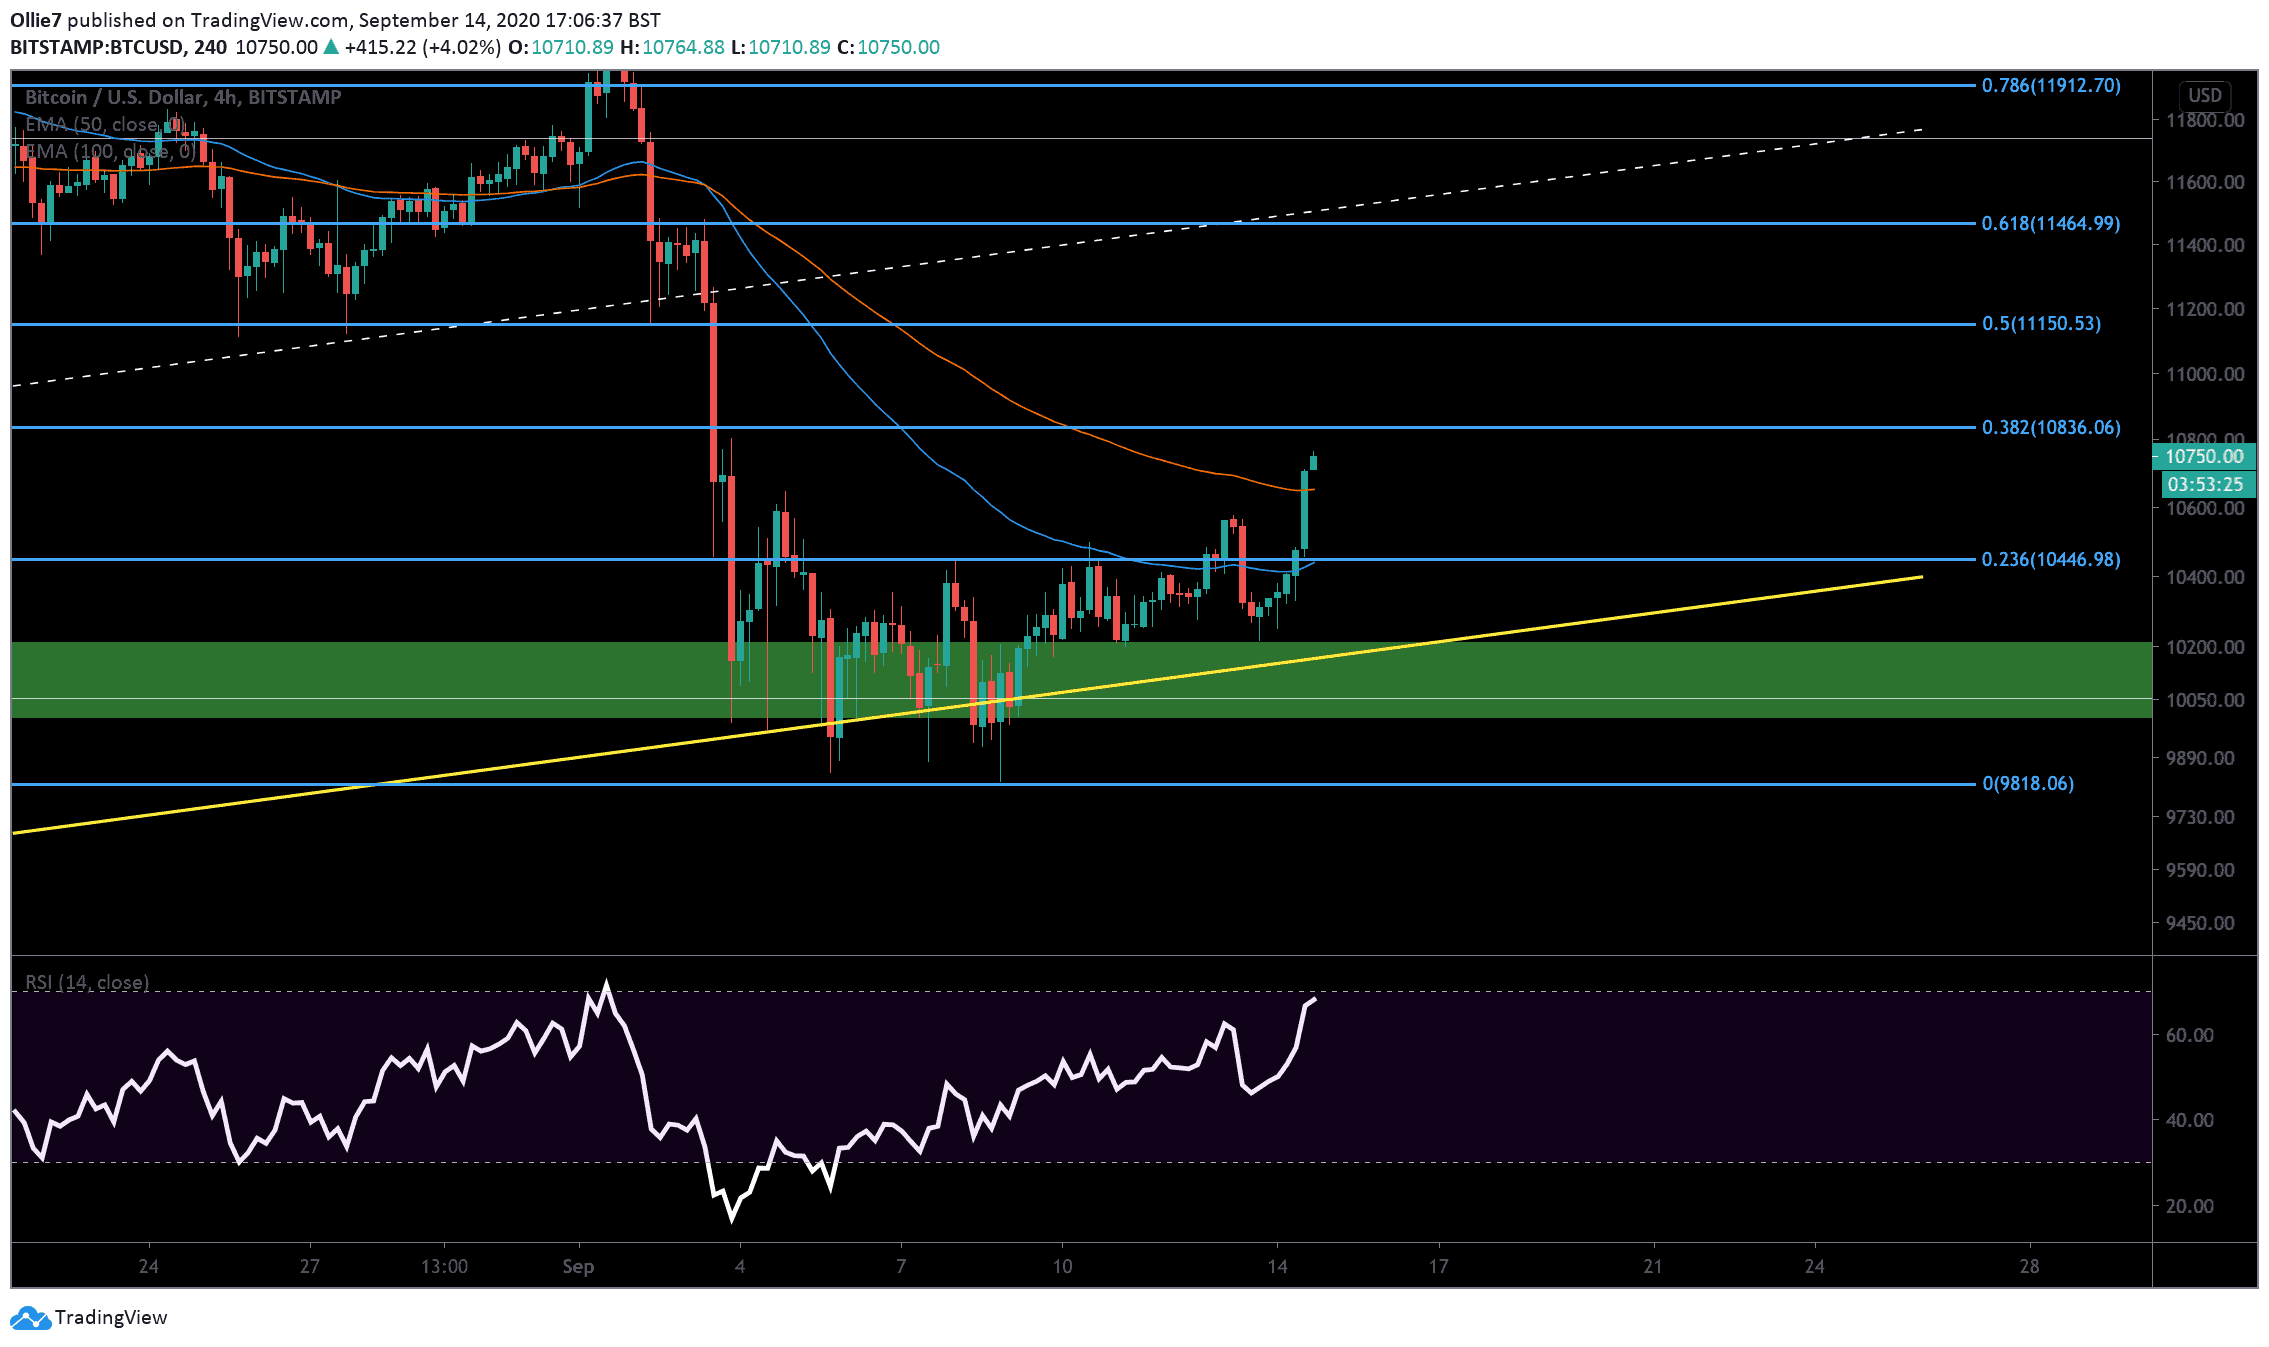
Now that the 200 EMA line (red) has been established as support (approx $10,650), bullish traders are in an excellent position to recharge and begin a second leg up towards the 0.382 Fibonacci level at $10,836. This particular area is also being reinforced by the daily 50-EMA line.
If they’re successful in breaking above this critical resistance zone, then there’s not a great deal standing in the way before the $11,000 mark, and the 0.5 Fibonacci level above at $11,150.
We should be mindful, though, that the CME gap below is still open between $9,950 and $9,665. If this does turn out to be another whale manipulation pattern, we could see a sharp decline send Bitcoin prices straight back into the previous range and towards this worrisome area.
The 0.236 Fibonacci level should provide a short-term safety net if prices start to tumble, which is also reinforced by the 4-hour 50 EMA line (blue).
On the daily MACD, however, there are some promising signs of a bullish reversal with the 12 and 24 moving average converging together for the first time since August 11. Volume on the histogram also appears to be about to flip bullish too.
Other bullish indications can be seen on the 4-hour chart, with candles now about to bullishly break through the Ichimoku cloud and the Chaikin Money Flow indicator line is the highest it’s been since June 27, 2019.
Total market capital: $355 billion
Bitcoin market capital: $198 billion
Bitcoin dominance: 55.7%
*Data by Coingecko.
Bitstamp BTC/USD 4-Hour Chart
Click here to start trading on BitMEX and receive 10% discount on fees for 6 months.
Disclaimer: Information found on CryptoPotato is those of writers quoted. It does not represent the opinions of CryptoPotato on whether to buy, sell, or hold any investments. You are advised to conduct your own research before making any investment decisions. Use provided information at your own risk. See Disclaimer for more information.
The post appeared first on CryptoPotato


