
Bitcoin price extended its decline and traded towards the $9,300 level against the US Dollar.The price is currently correcting higher, but it is likely to struggle near $9,600 and $9,760.There is a short term breakout pattern forming with resistance near $9,500 on the hourly chart of the BTC/USD pair (data feed from Kraken).The price is likely to resume its decline after a short term correction towards $9,760 or $9,800.Bitcoin price is trading in a higher degree downtrend below $10,000 against the US Dollar. BTC remains at a risk of more downsides as long as it is below $10,000.Bitcoin Price AnalysisRecently, we saw a bearish break below the $10,000 and $9,800 support in BTC against the US Dollar. The price even settled below the $9,760 support and the 100 hourly simple moving average. Finally, there was a break below the $9,500 support and the price extended its decline towards the $9,300 level. A swing low was formed near $9,308 and the price is currently correcting higher.An immediate resistance is near the $9,500 level. Additionally, the 23.6% Fib retracement level of the recent decline from the $10,304 high to $9,308 low is also near the $9,500 level. More importantly, there is a short term breakout pattern forming with resistance near $9,500 on the hourly chart of the BTC/USD pair. Therefore, if there is an upside break above $9,500, the price could extend its upside correction.The next key resistance is near the $9,760 level (the previous support). However, the main resistance is near the $9,800 level. It coincides with the 50% Fib retracement level of the recent decline from the $10,304 high to $9,308 low. To move back in a positive zone, the price must break the $10,000 resistance and the 100 hourly simple moving average.On the downside, an initial support is near the $9,400 level. If there is a downside break below the $9,400 and $9,300 levels, the price could extend its decline. The next target for the bears could be near the $9,000 level. An intermediate support is near the $9,200 level.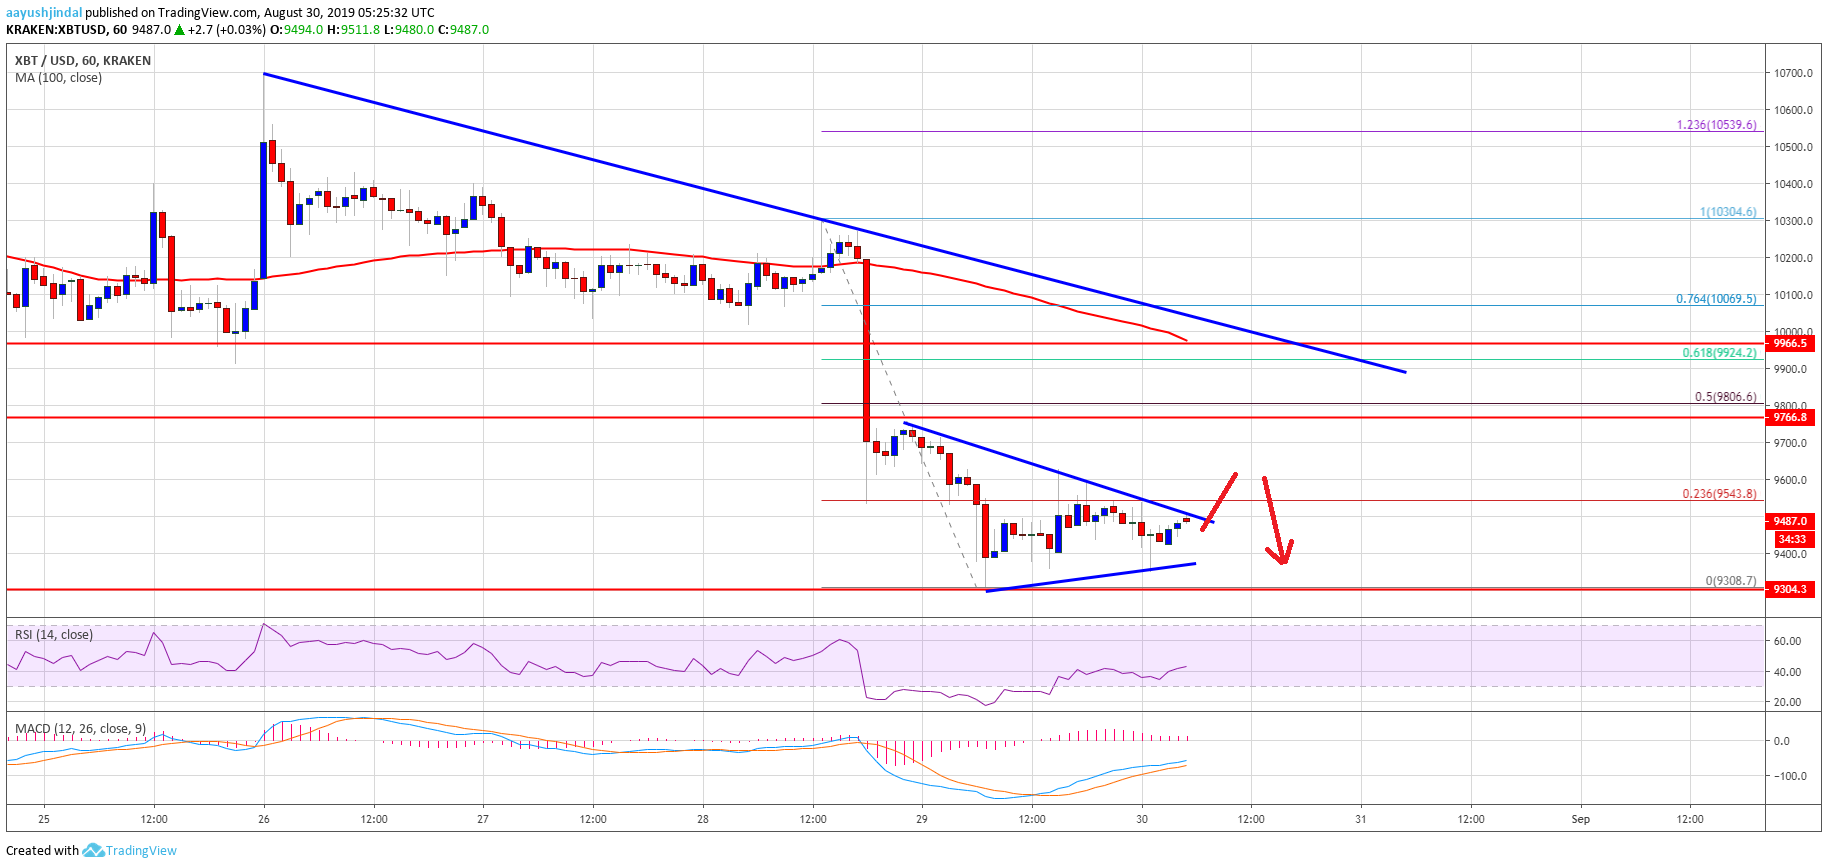 Looking at the chart, bitcoin price is clearly trading in a higher degree downtrend below $10,000. In the short term, there could be an upside correction above $9,500 and $9,600. However, the bulls are likely to face a lot of hurdles near the $9,760 and $9,800 level. The main hurdle is near the $10,000 pivot level.Technical indicators:Hourly MACD – The MACD is slowly gaining pace in the bullish zone.Hourly RSI (Relative Strength Index) – The RSI for BTC/USD is recovering towards the 50 level.Major Support Levels – $9,400 followed by $9,300.Major Resistance Levels – $9,600, $9,760 and $9,800.The post appeared first on NewsBTC


