
Bitcoin price is gaining momentum and it recently traded above $10,700 against the US Dollar.The price is currently testing the key $10,800 resistance area and it might correct a few points.There is a new bullish trend line forming with support near $10,600 on the hourly chart of the BTC/USD pair (data feed from Kraken).The price remains well bid and it is likely to climb further above the $10,800 and $11,000 resistances.Bitcoin price is trading in an uptrend above $10,600 against the US Dollar. BTC surge once there is a successful break above the $10,800 and $11,000 resistances.Bitcoin Price AnalysisYesterday, there were further upsides in BTC above the $10,750 resistance area against the US Dollar. The price even broke the $10,800 level and settled above the 100 hourly simple moving average. A new monthly high was formed near $10,893 before the price started a downside correction. There was a break below the $10,750 and $10,600 levels. Moreover, the price spiked below $10,500, but downsides were contained.A swing low was formed near $10,463 and the price started a fresh increase. It broke the $10,600 resistance to move back into a positive zone. Additionally, there was a break above the 50% Fib retracement level of the last slide from the $10,893 high to $10,463 low. The bulls even pushed the price above a connecting bearish trend line with resistance at $10,560 on the hourly chart of the BTC/USD pair.The price is now testing the $10,800 resistance area. Moreover, it seems like the 76.4% Fib retracement level of the last slide from the $10,893 high to $10,463 low is acting as a resistance. If there is an upside break above the $10,800 and $10,880 levels, the price could continue to rise. In the mentioned case, the price will most likely break the $11,000 resistance level.Conversely, if the price fails to break the $10,800 and $10,880 resistance levels, it could correct lower. An immediate support is near the $10,650 level. Additionally, there is a new bullish trend line forming with support near $10,600 on the same chart. Below the trend line, the price could revisit the $10,500 support area in the near term.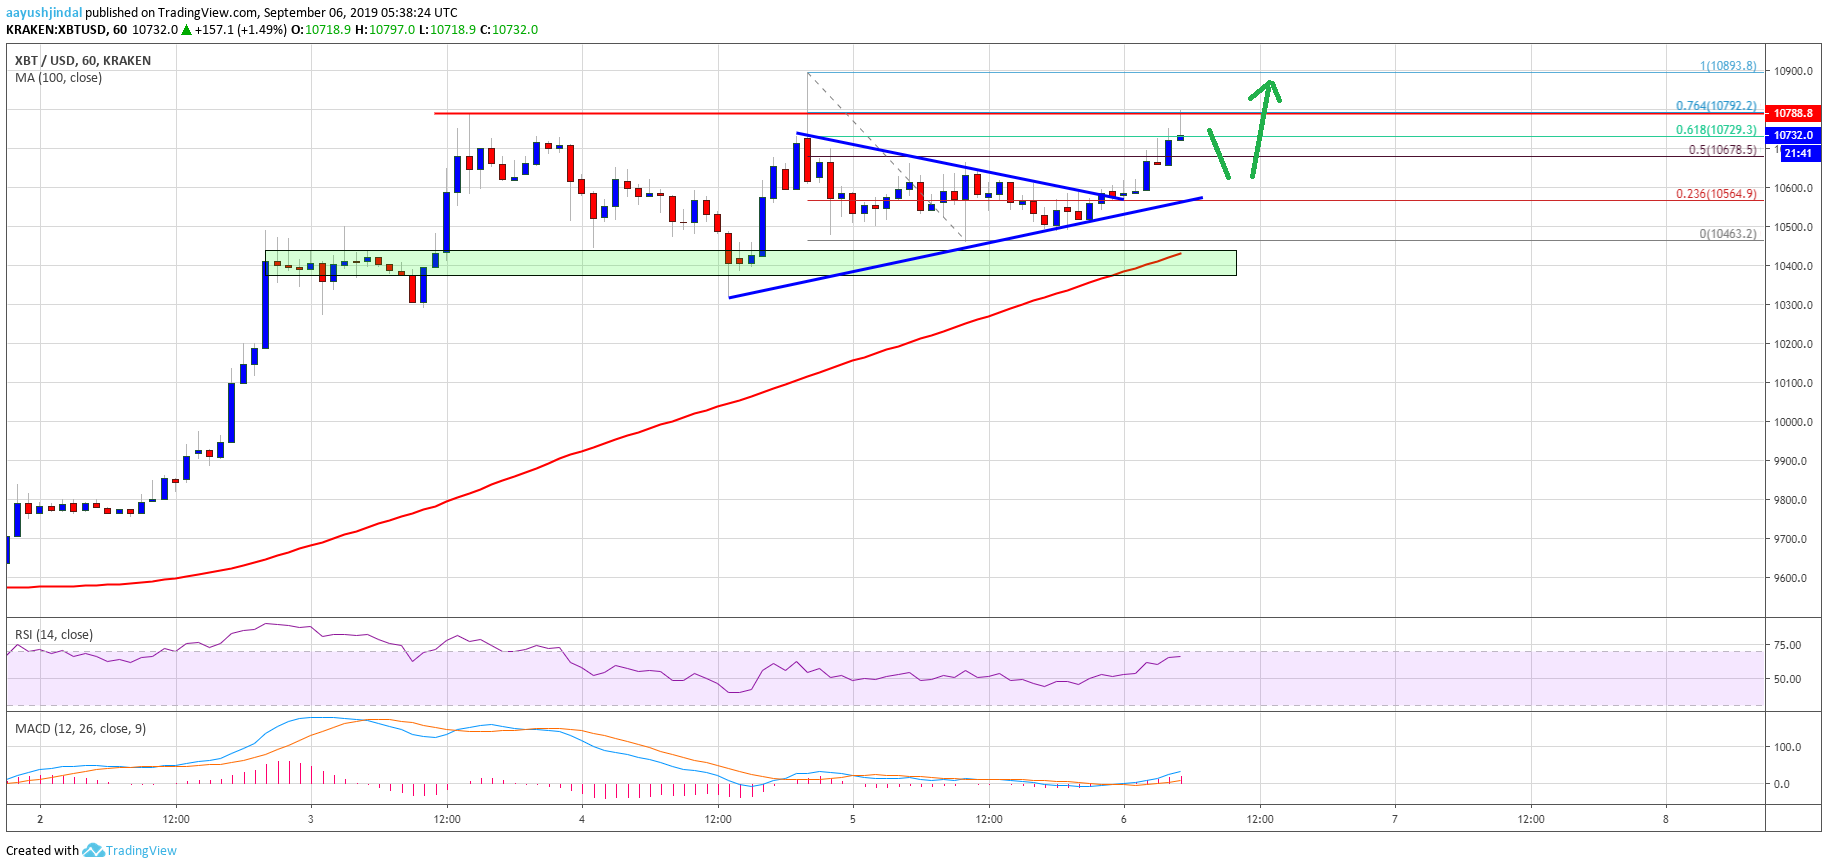 Looking at the chart, bitcoin price is clearly gaining momentum above $10,700 and it will most likely break the $10,800 and $10,880 resistance levels. Finally, if there is a break above $11,000, the price could test $11,250.Technical indicators:Hourly MACD – The MACD is slowly gaining pace in the bullish zone.Hourly RSI (Relative Strength Index) – The RSI for BTC/USD is moving higher towards the 75 level.Major Support Levels – $10,600 followed by $10,500.Major Resistance Levels – $10,800, $10,880 and $11,000.The post appeared first on NewsBTC


