
After dull weekend action, and as we anticipated here yesterday, Bitcoin price waited for the Wall Street Monday futures forecasts in order to execute its next move.
In our yesterday’s price analysis, we spoke about the tightening range Bitcoin was going through:
“The upper boundary lies around $9500, while the bottom lies at $9350. A breakout to any direction is likely to point out the next short-term direction for Bitcoin.”
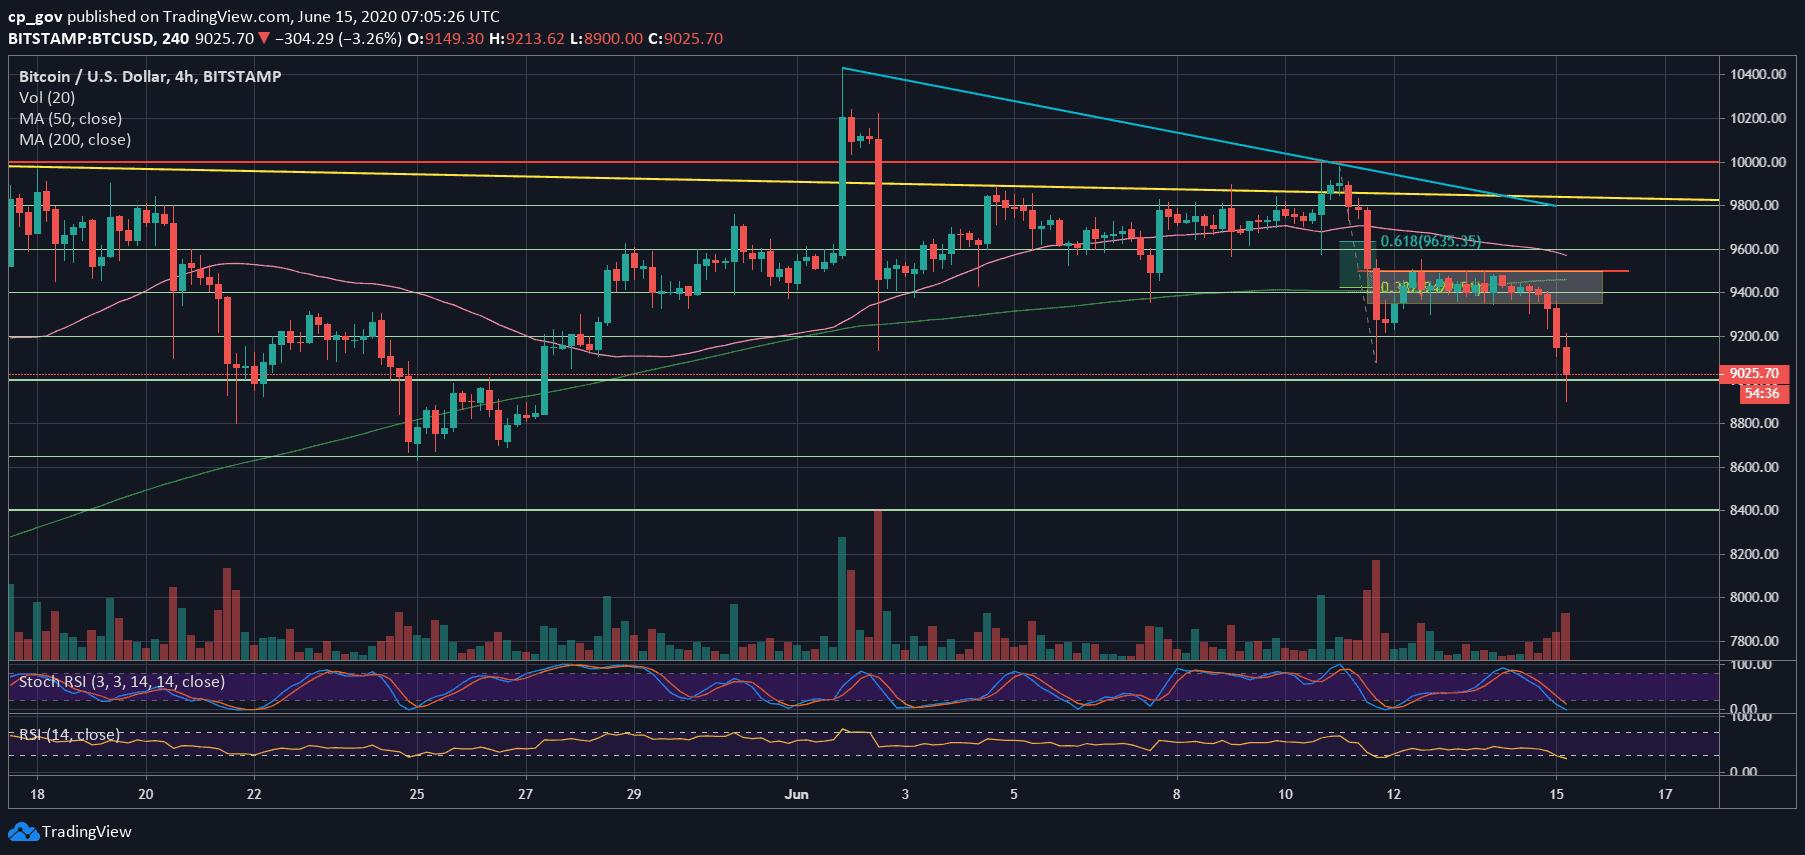
Looking at the following 4-hour chart reveals that the move had started once the Futures were starting (Sunday afternoon U.S. time). The marked rectangle is no longer holding.
As of writing these lines, Bitcoin is trading slightly below the $9000 mark.
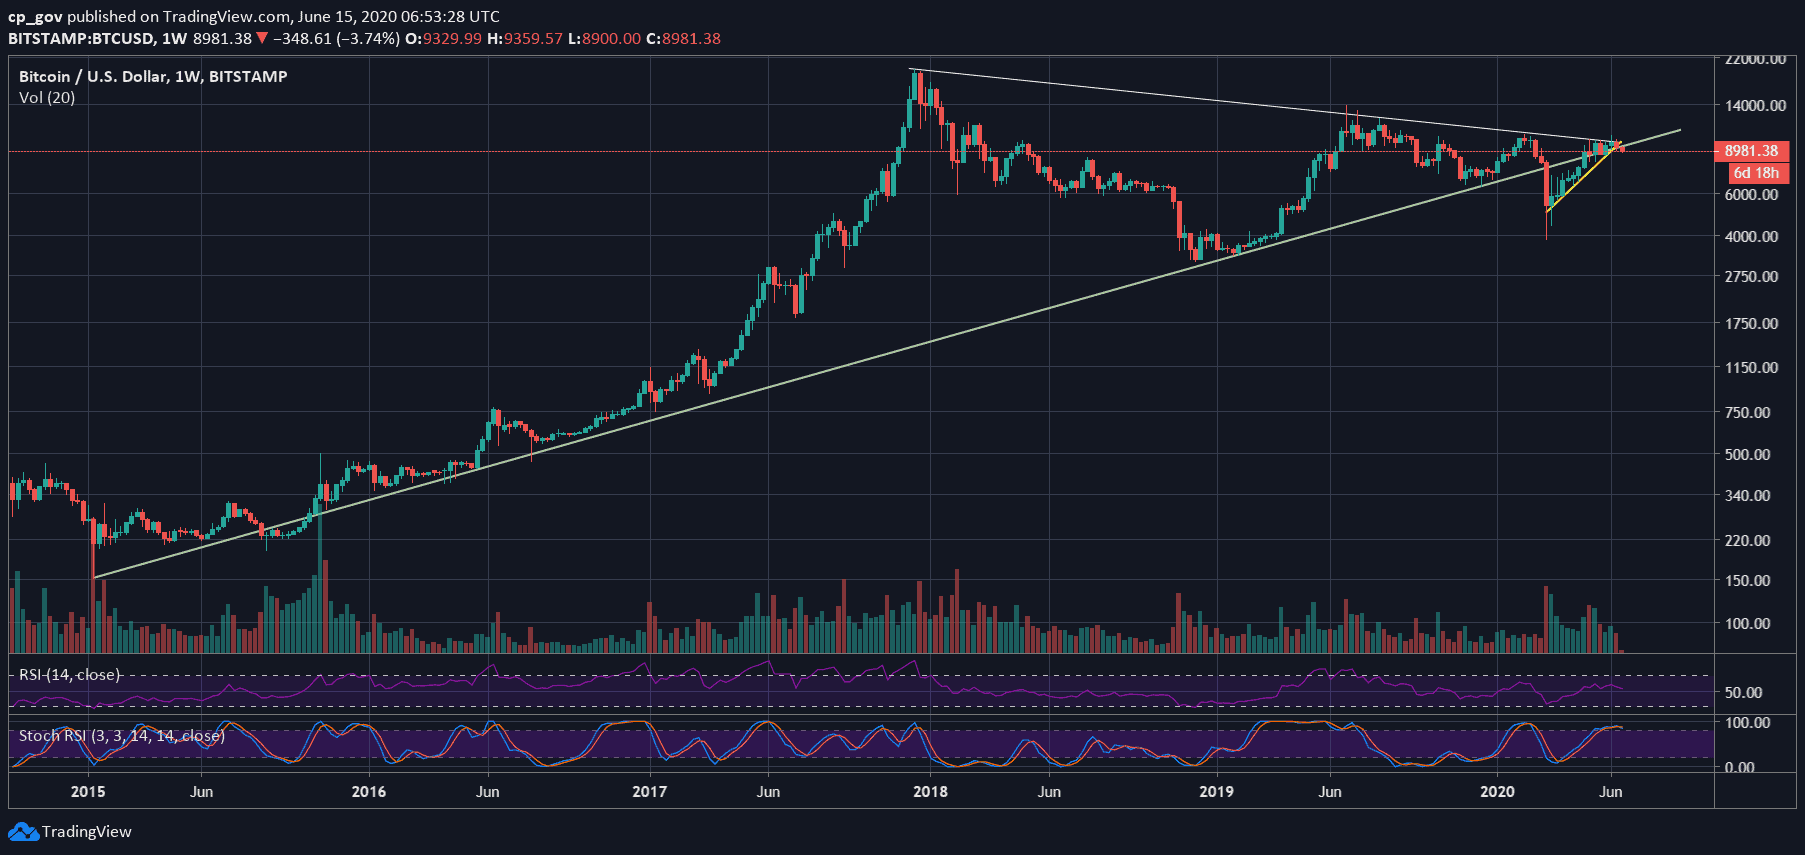
Support Line From 2015: Gone?
Unfortunately, Bitcoin is very dependent on the other assets, which are the global markets. At the same time, Gold is in the green territory. The decoupling we saw a month ago was only temporary.
Looking at the bigger picture, which is the weekly chart, we can see that Bitcoin’s new weekly candle is developing below both the short-term ascending trend-line and the long-term one (which is more crucial and started forming in 2015).
On the weekly timeframe, Bitcoin will look to close this week’s candle above $9300.
Short-term Support and Resistance Levels To Watch
On the micro-level, Bitcoin is now fighting to stay on top of the $8900 – $9000 level. In case the area breaks down, then the next support is likely to be found at $8650 (May 26 support).
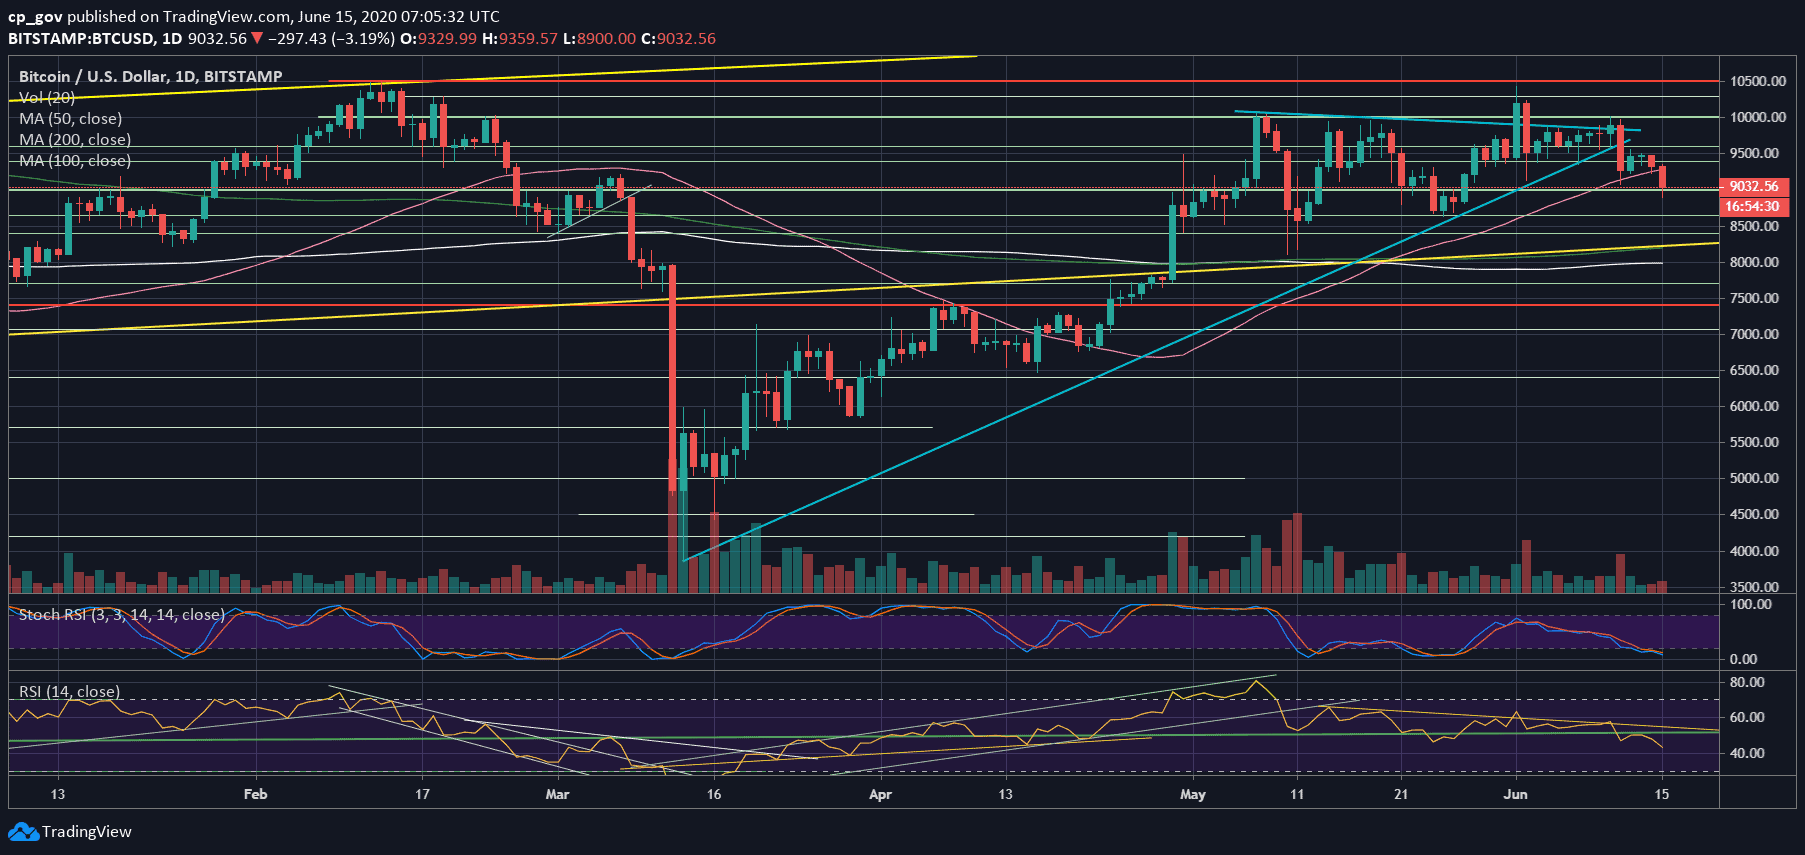
Further below lies $8400, followed by the yellow-marked ascending trend-line on the daily chart, together with the significant 200-days moving average line (light green) – around $8200. Below lies $8K, which is the lowest since April.
From above, in case that Bitcoin holds here, we will look at the first critical level – the mentioned $9300, along with the 50-days moving average line (marked pink). Further above lies $9500 (the upper angle of the rectangle on the 4-hour chart).
The daily RSI looks bearish after confirming the 50 line as resistance. The stochastic RSI oscillator both on the daily and the 4-hour chart is nearing the oversold area. This might give some fuel for a correction, but it’s too early to indicate, as of writing these lines.
The trading volume was extremely low over the weekend. It will be interesting to see if high amounts of volume followed Monday’s sell-off once the daily candle is completed.
Total Market Cap: $255 billion
Bitcoin Market Cap: $166 billion
BTC Dominance Index: 65.1%
*Data by CoinGecko
BTC/USD BitStamp 4-Hour Chart
BTC/USD BitStamp 1-Day Chart
The post Bitcoin Price Crashes Below $9000 – Breaking Crucial Support From 2015: BTC Analysis & Weekly Overview appeared first on CryptoPotato.
The post appeared first on CryptoPotato


