
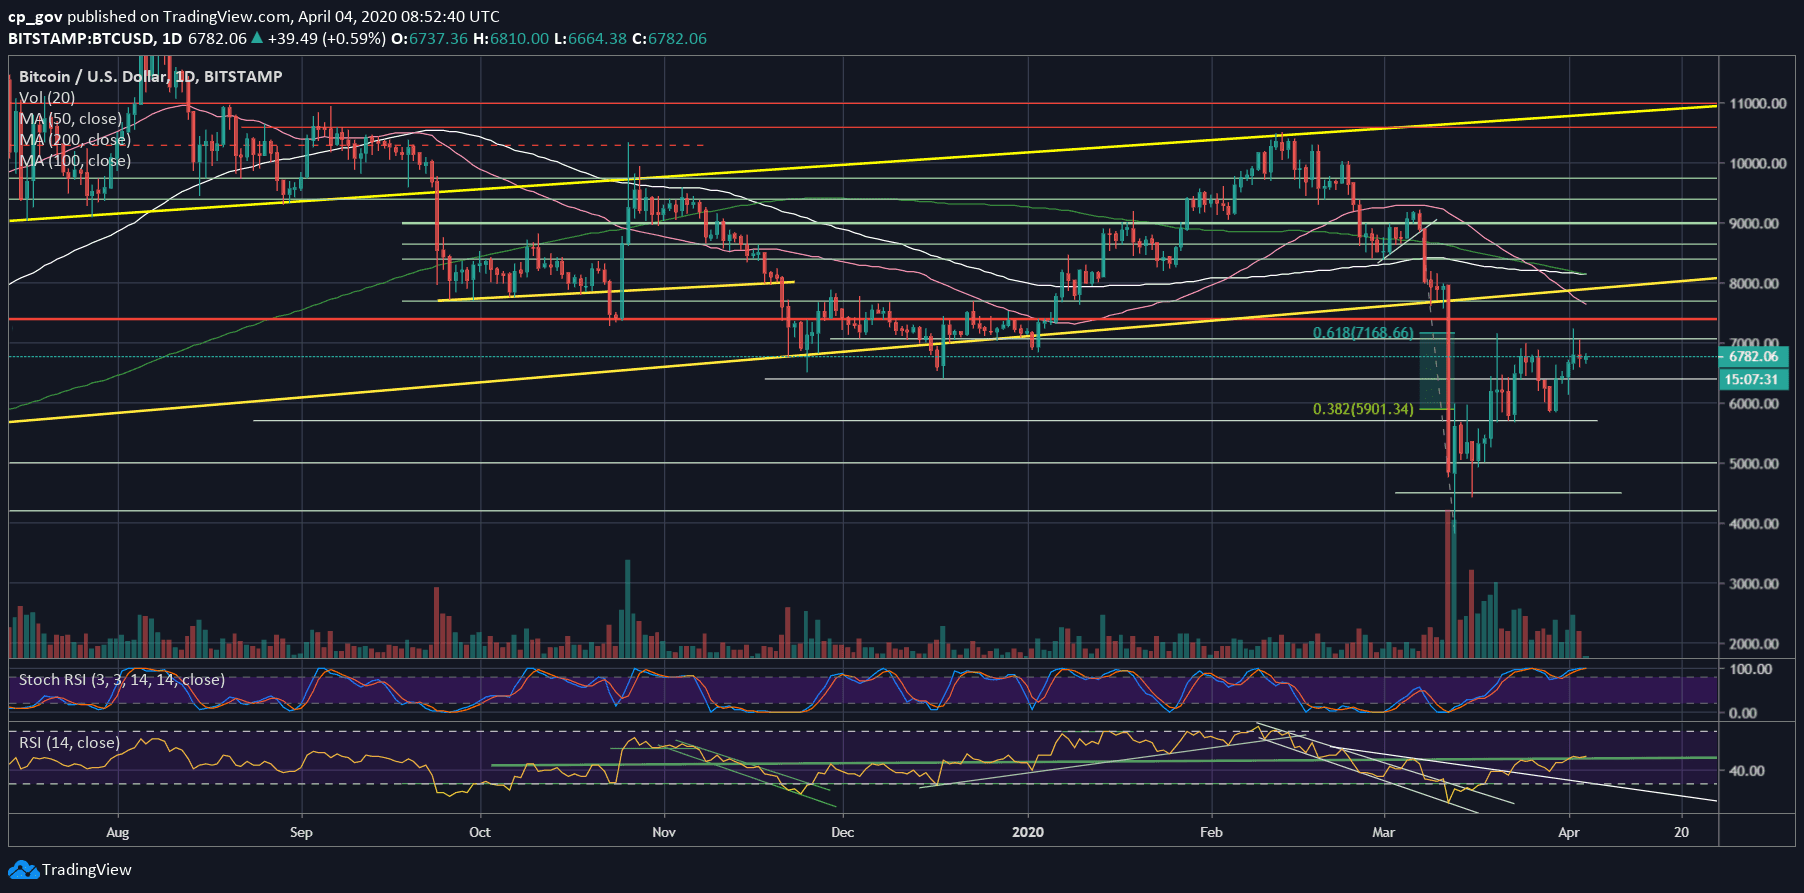
The past days were promising for Bitcoin: After finally succeeding in breaking the $6800 resistance mark, Bitcoin price had seen a decent run of $400 to the reach $7236 as the highest price since the March 12 collapse.
As mentioned in our previous price analysis, while Bitcoin was trading around $6700: “we already identify bullish divergence, which can fuel the next move above.”
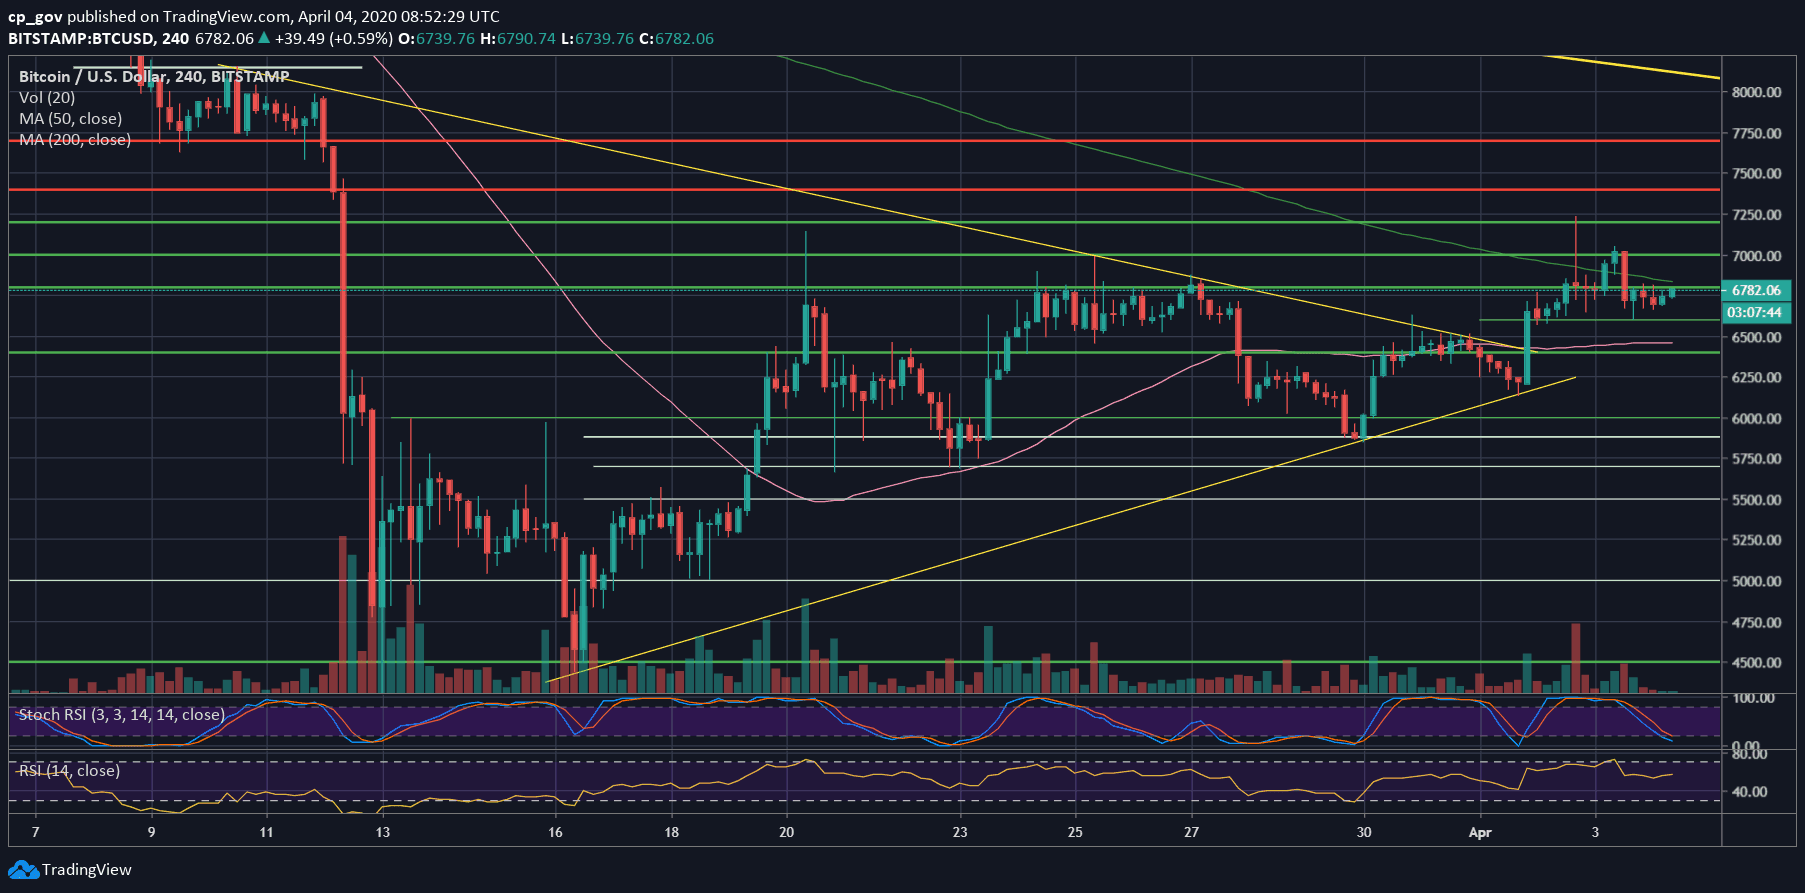
The overall setting looks bullish on the 4-hour chart, going through healthy higher-lows trajectory. However, the mini bull-run from Thursday stopped at the same high from March 20. This might end as a double-top formation, which is a bearish pattern that marks short-term top.
The latter will invalidate once Bitcoin breaks above the $7200 area and build demand around it. What we saw on Thursday is a nice tryout, but many sellers were waiting around the $7200 level, what quickly pushed Bitcoin back down to the $6600 – $6800 range.
For the short term, Bitcoin found support upon the $6600 level, facing the $6800 – $6900 resistance area from above.
Total Market Cap: $189.9 billion
Bitcoin Market Cap: $123.8 billion
BTC Dominance Index: 65.2%
*Data by CoinGecko
Key Levels To Watch & Next Possible Targets
– Support/Resistance levels: As mentioned above, Bitcoin is now facing the familiar $6800 – $6900 resistance area.
Further above lies $7000, followed by the $7200 price zone, which is defined as critical level for Bitcoin to prove short-term bullishness and cancel the double-top threat.
If we see a new April high, then the next resistance should be around $7400, before reaching $7700. The last will mark a full recovery from the March 12 dump.
From below, the initial level of support lies at $6600. Down below lies the $6300 – $6400 support area, followed by $6200.
– The RSI Indicator: Despite the recent day’s bullishness, Bitcoin is still facing the crucial RSI level of 50. A bullish signal if, and only if, breaking back above the 50 RSI levels.
– Trading volume: Thursday’s bullish run was followed by the highest amount of trading volume over the last ten days. However, the volume was still far below the March highs.
BTC/USD BitStamp 4-Hour Chart
BTC/USD BitStamp 1-Day Chart
The post Bitcoin Price Facing Huge Decision: Bearish Double-Top, Or Finally Break Above The $7,200 3-Week High – BTC Price Analysis appeared first on CryptoPotato.
The post appeared first on CryptoPotato


