
So much for ‘this is the last time you’ll see Bitcoin under five figures”.
Bitcoin price is now hovering along the top of the unfilled CME gap at $9,925, and looking very likely that it will break down to $9,665 soon to close it off. This anticipation of more downside in the short-term has been reflected by the global crypto market capital, which has fallen by a further $15 billion in the last 24 hours.
It is hoped, however, that once the gap is filled, there will be nothing holding back the #1 crypto asset from restarting its climb back towards setting a new YTD-high.
Price Levels to Watch in the Short-term
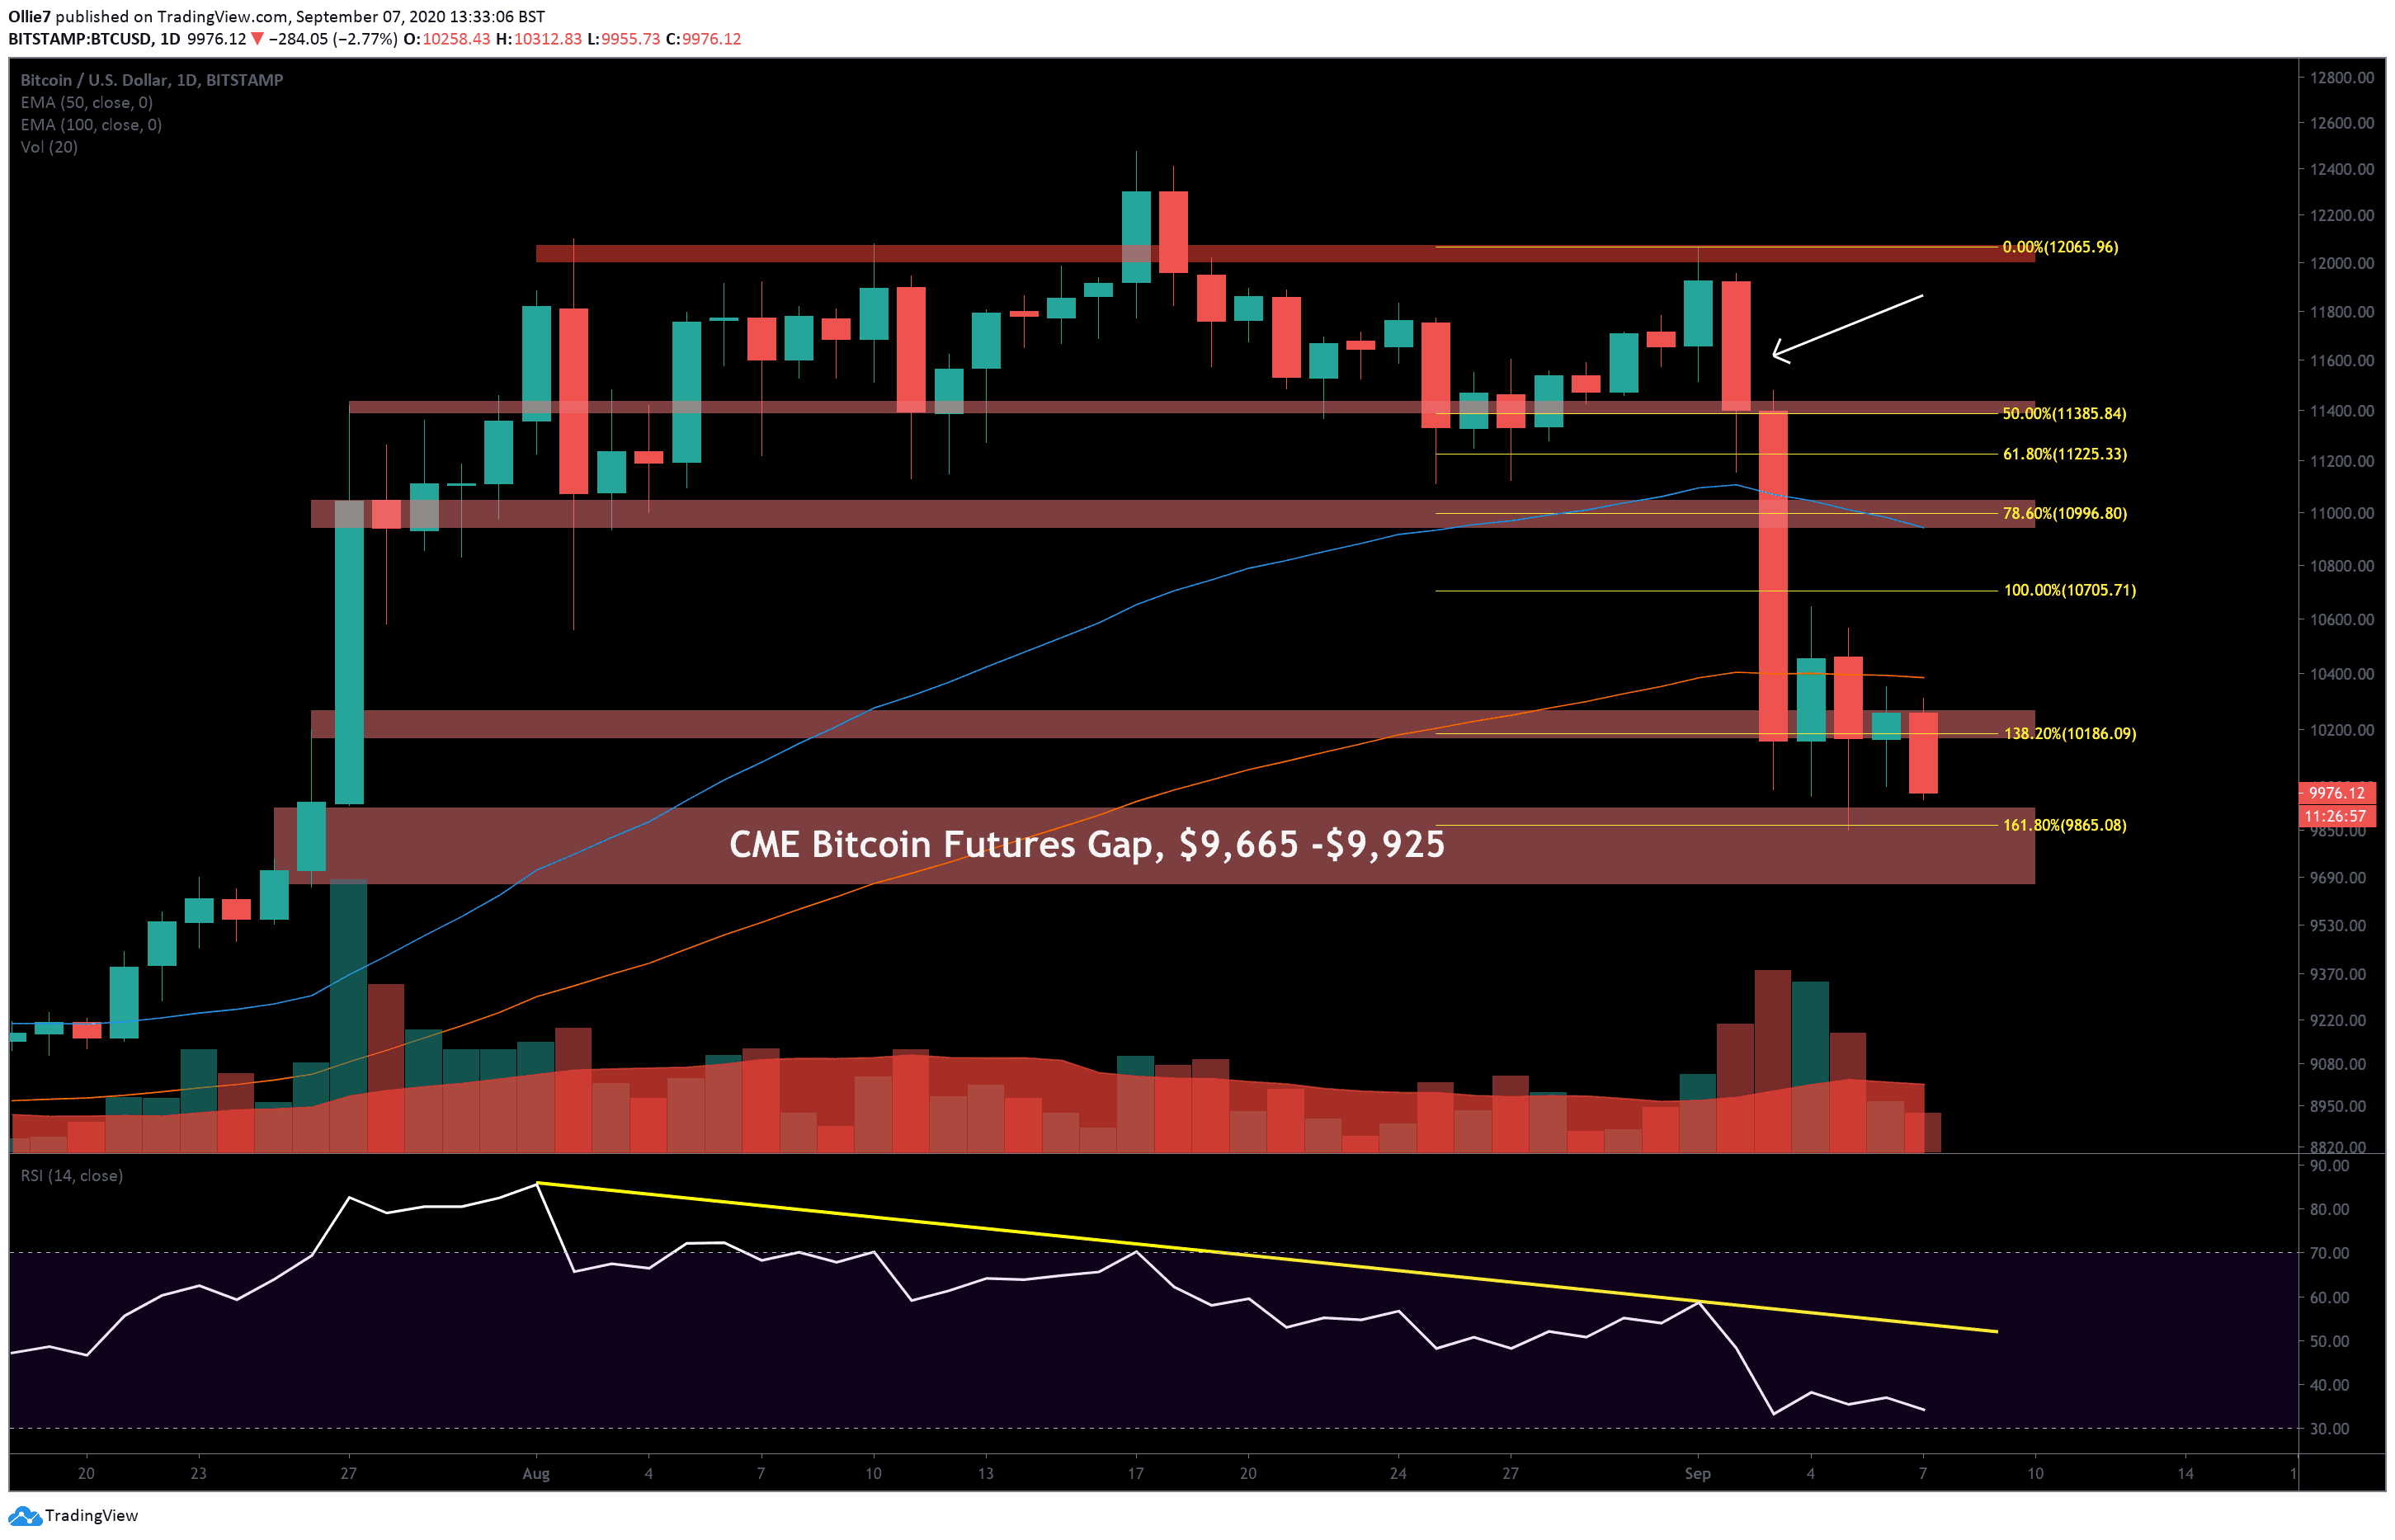
On the daily BTC/USD chart, we can see that the primary support (1.318 Fibonacci extension level) at $10,180, which propped up Bitcoin over the last four days, gave way during the Asian trading session today.
Now, bullish traders are attempting to regain the psychological $10,000 level as a support, while bears continue to drive towards the $9,665 CME gap target.
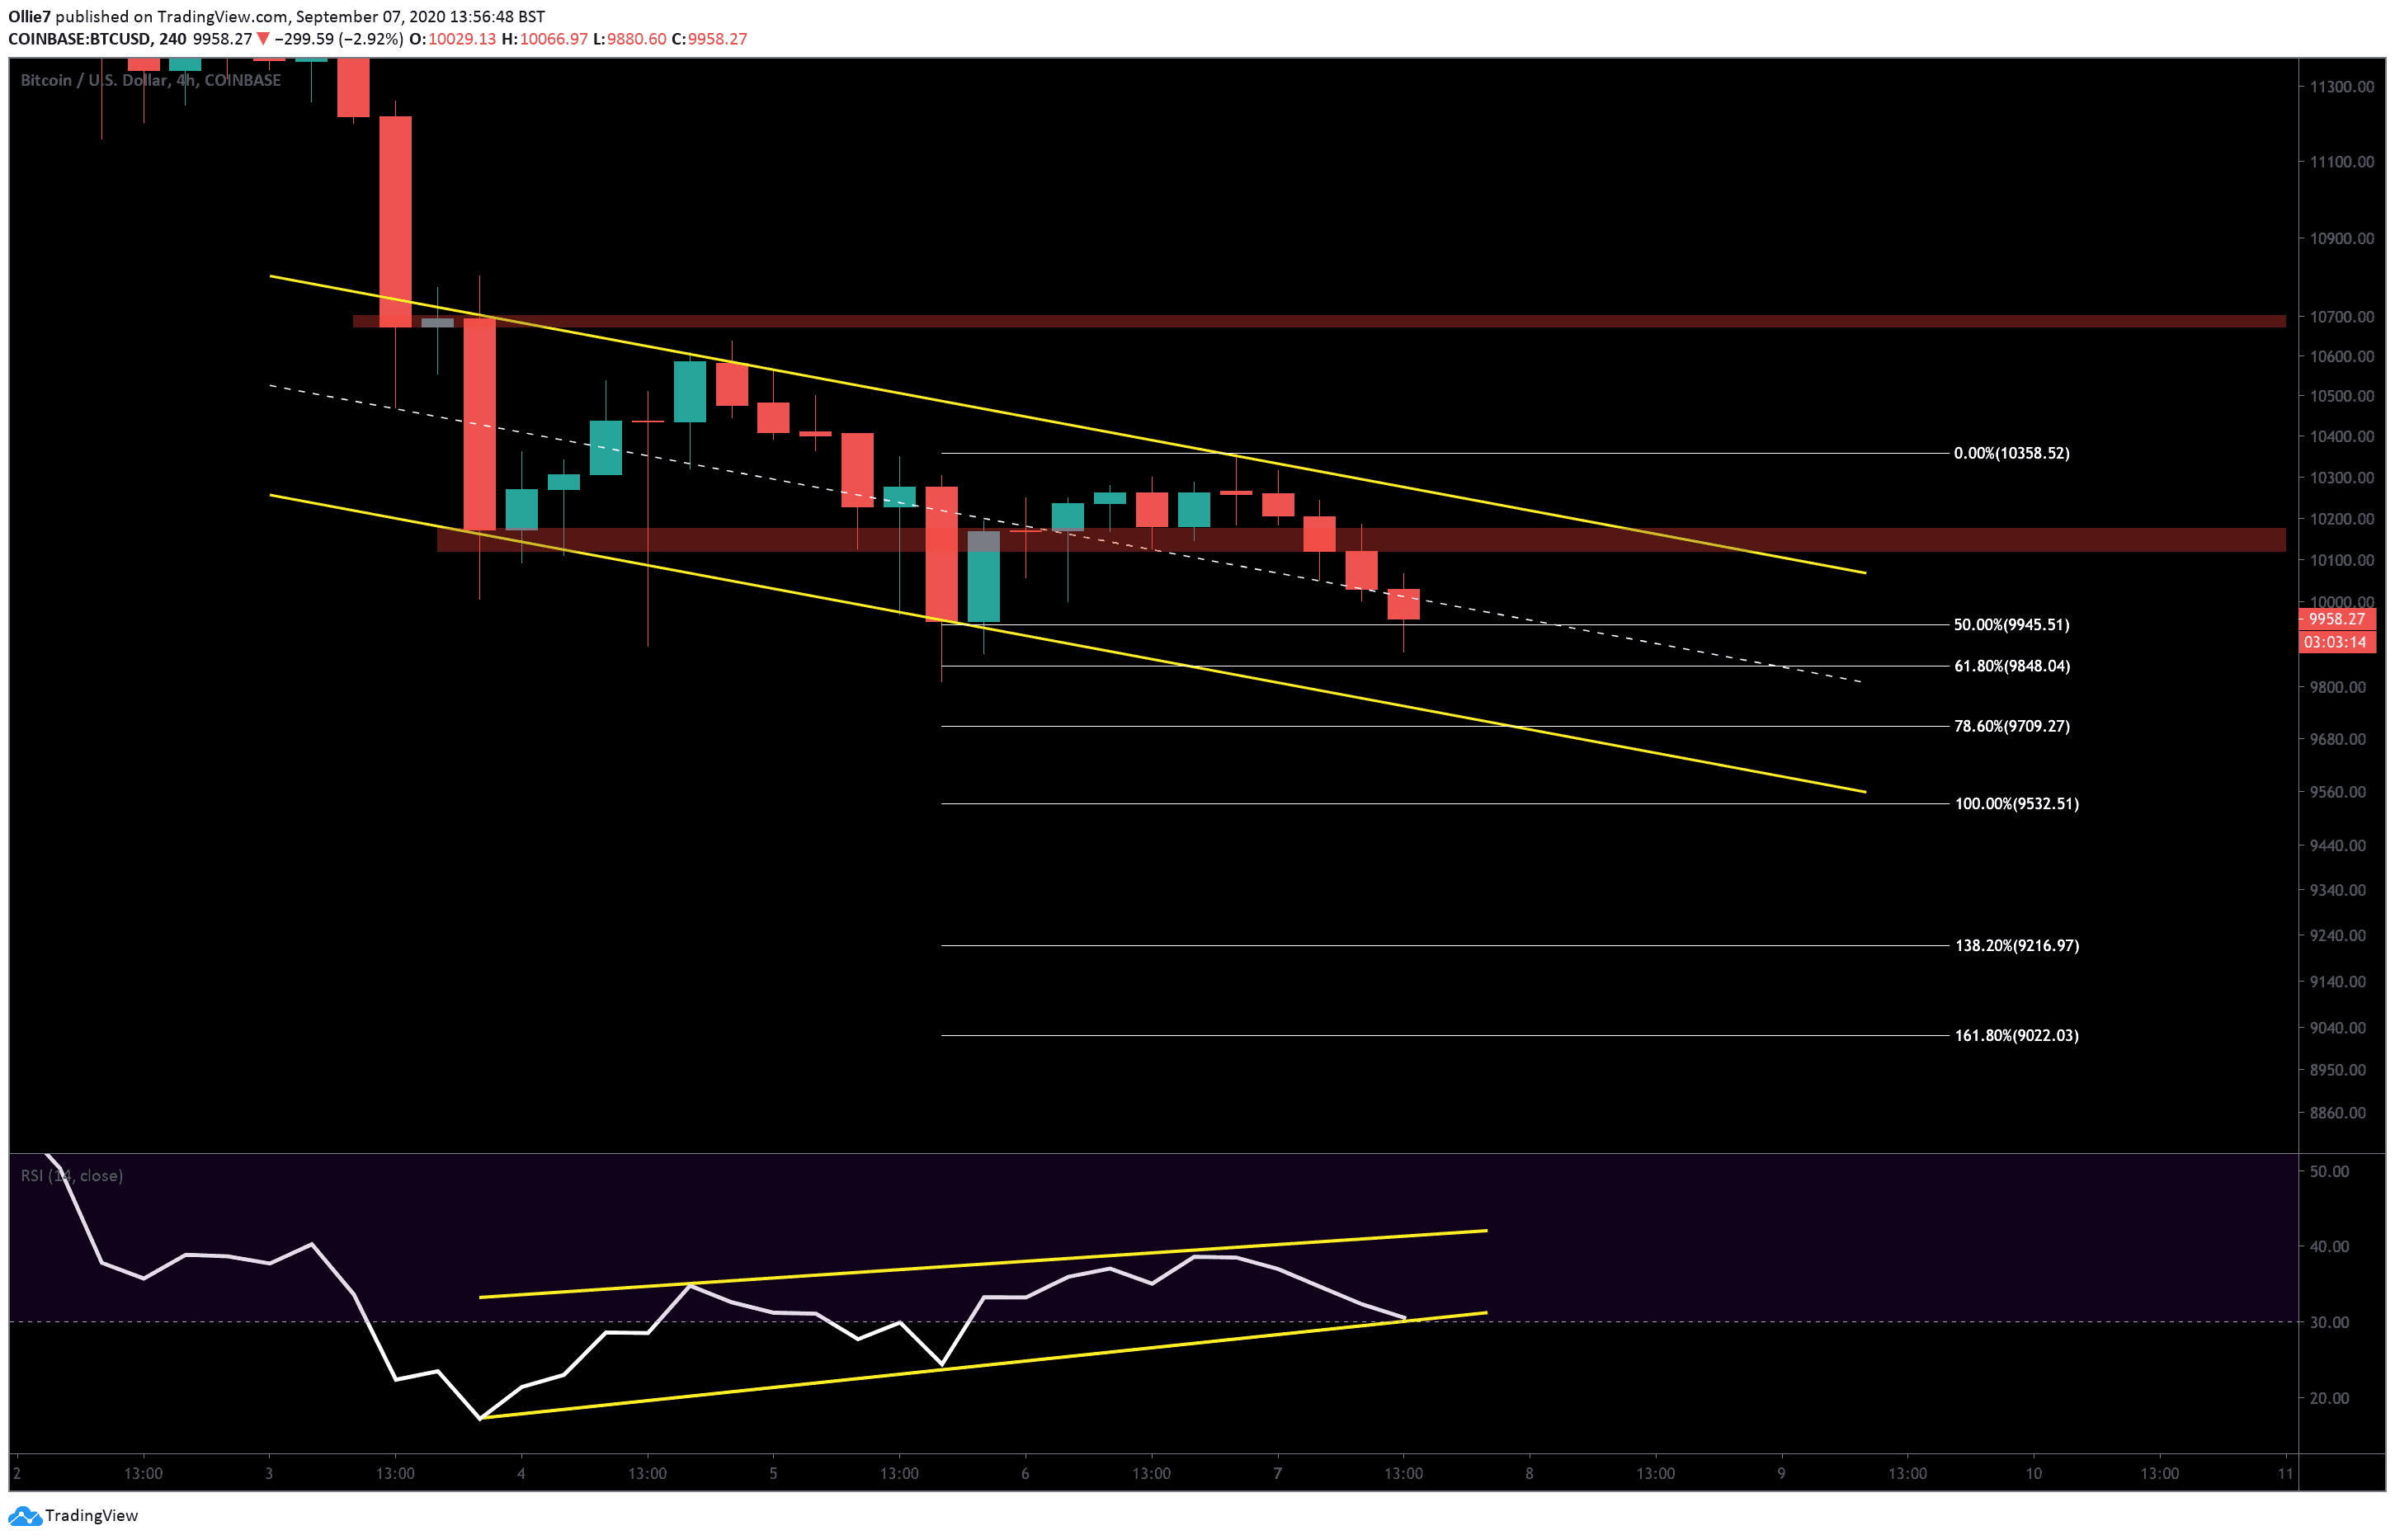
Looking at the 4-hour chart, it’s clear that the current price action is tracking inside a downtrending channel, with two strong resistance areas above. The first zone sits between the $10,170 and $10,120 levels (first red area), followed by an order block resistance further up between the $10,670 and $10,700 levels (second red area).
The $10,700 level also overlaps with the 1.0 Fibonacci extension level, which should make that particular area even more difficult to break above.
On the daily chart, the 100 EMA (red) – which currently sits at $10,385 – could also create some friction if Bitcoin reverses.
Looking further down, we can see 4-hour Fibonacci extension supports are projected at $9,945, $9,848, $9,532, $9,216, and $9,022 if BTC crashes further after filling the gap.
Over this timeframe, there is a reasonably promising RSI divergence, which suggests short-term buying momentum is gaining strength (yellow). While BTC price has been making consistently lower lows, the RSI indicator line has printed two notable higher lows and re-entered back into the channel from the oversold region.
This tends to foreshadow a trend reversal, but we’ll need to wait until more volume arrives before it plays out.
Total market capital: $325 billion
Bitcoin market capital: $185 billion
Bitcoin dominance: 57.0%
*Data by Coingecko
Bitstamp BTC/USD Daily Chart
Coinbase BTC/USD 4-Hour Chart
Click here to start trading on BitMEX and receive 10% discount on fees for 6 months.
Disclaimer: Information found on CryptoPotato is those of writers quoted. It does not represent the opinions of CryptoPotato on whether to buy, sell, or hold any investments. You are advised to conduct your own research before making any investment decisions. Use provided information at your own risk. See Disclaimer for more information.
The post appeared first on CryptoPotato


