
Bitcoin price has broken over $14,100 for the first time since January 15, 2018 – a staggering 1,020 days ago. The move has coincided with the 12-year anniversary of the first release of the Bitcoin whitepaper and $7 billion flooding back into the market during the start of the US trading session.
Is this the start of the new bull cycle PlanB has been predicting that will propel BTC prices to over $100,000 per coin?
Price Levels to Watch in the Short-term
On the 4-hour BTC/USD chart, we can see that bullish traders are battling hard right now to defend $13,900 after selling pressure at the psychological $14K sent bitcoin’s price tumbling.
Just underneath, there is a new flipped level at the former YTD-high ($13,800), which should provide some intraday support if prices continue to retreat. If bears can overcome this, then additional supports can be found at the $13,600, $13,270, 50-EMA line (blue) at $13,190, and main channel support at $12,970.
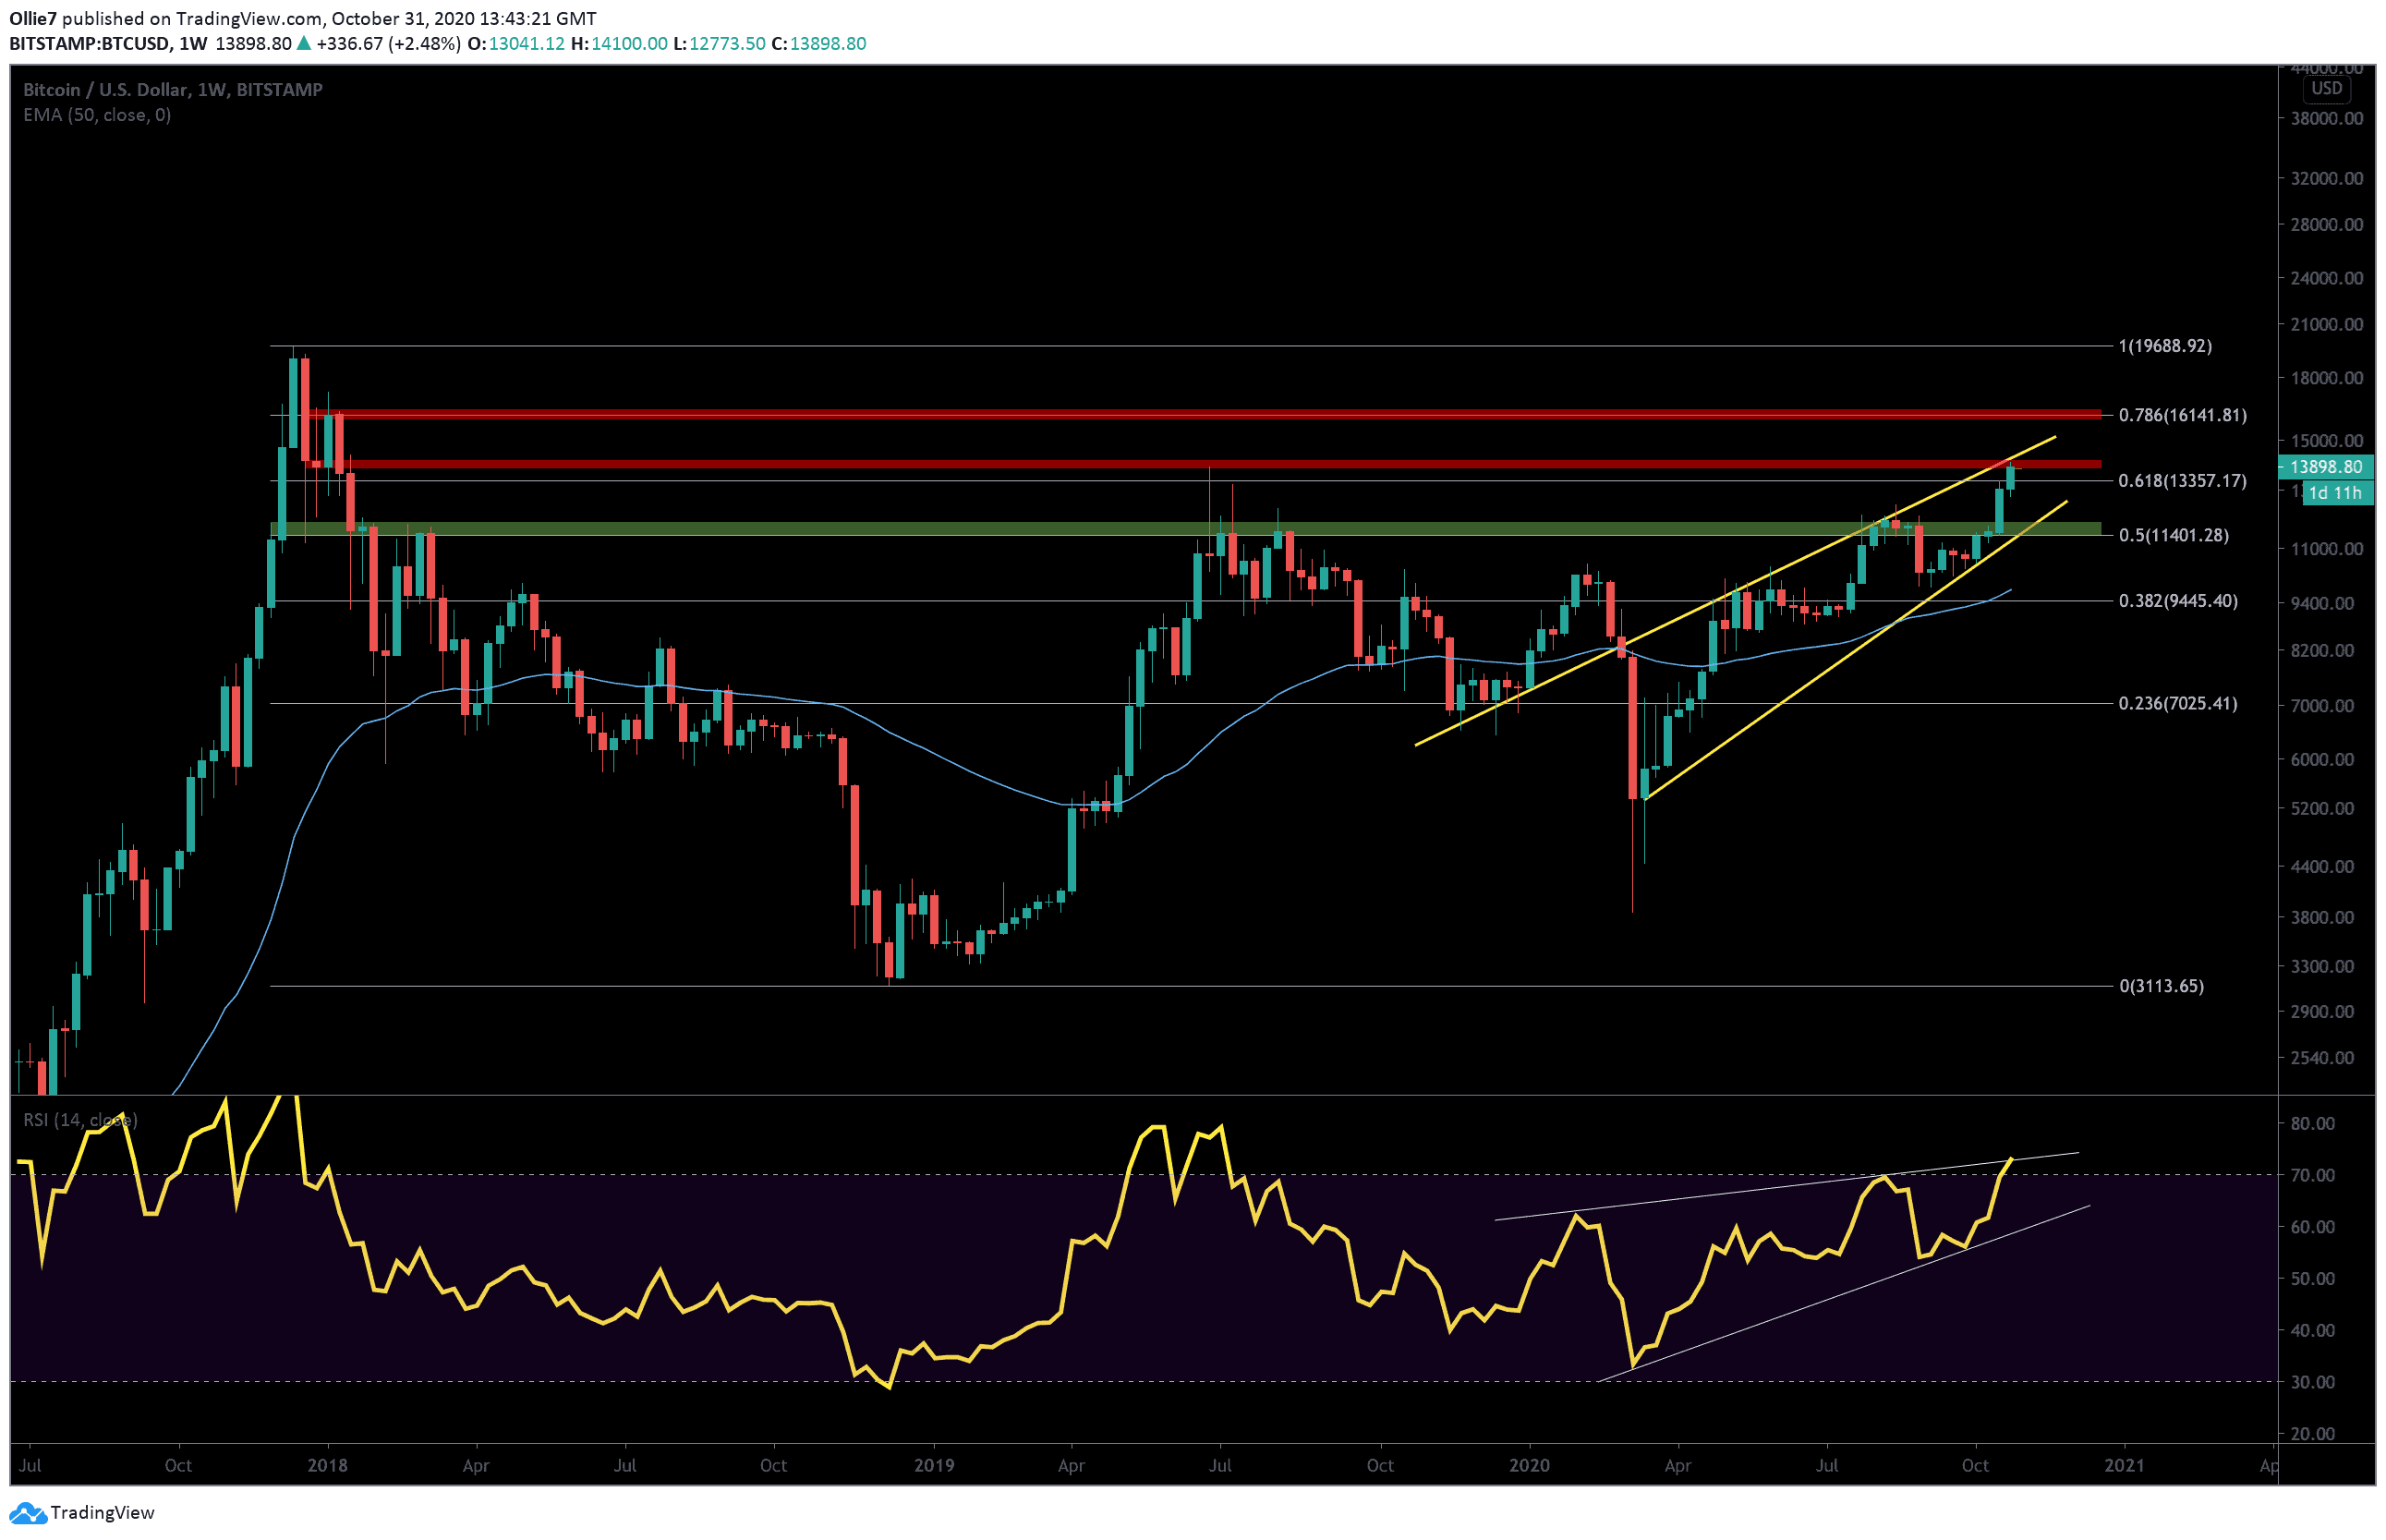
Taking a broader look using the weekly chart, we can that prices continue to track inside a steep rising wedge pattern. This is typically a bearish reversal pattern, but it can sometimes be rejected if substantial buying volume arrives when the price action reaches maximum consolidation.
Looking above at the next most likely price targets, the weekly $14,670 level, $14,380, and $15,000 are the most obvious resistances Bitcoin will face if the uptrend continues. After that, there doesn’t appear to be many resistances in the way until the fabled $16,000 mark.
The Technicals
On the 4-hour RSI, we can see the latest rally was foreshadowed by a new higher low (white arrow) on the indicator – as was predicted in the previous bitcoin analysis. However, even though the latest surge has pushed BTC above the RSI resistance line (red), we still have yet to see a new higher high appear.
Bitcoin has not even broken above the overbought region on the RSI indicator yet, which will likely pile new selling pressure on top of the uptrend and could keep BTC from recovering above $14K in the short-term.
On the weekly RSI, however, we can see that the leading crypto has, in fact, broken into the overbought region for the first time since July 2019. Again, this will likely have some impact on the price action as we go into the new week.
Total market capital: $409 billion
Bitcoin market capital: $256 billion
Bitcoin dominance: 62.6%
*Data by Coingecko.
Bitstamp BTC/USD Weekly Chart
Bitstamp BTC/USD 4-Hour Chart

Binance Futures 50 USDT FREE Voucher: Use this link to register & get 10% off fees and 50 USDT when trading 500 USDT (limited offer).
Disclaimer: Information found on CryptoPotato is those of writers quoted. It does not represent the opinions of CryptoPotato on whether to buy, sell, or hold any investments. You are advised to conduct your own research before making any investment decisions. Use provided information at your own risk. See Disclaimer for more information.
The post appeared first on CryptoPotato


