
Things happen fast in crypto. Yesterday’s analysis focused on the tight range of $200 Bitcoin was trading inside over the past days.
We had clearly stated in yesterday’s analysis that a huge price move is imminent. Just a few hours after, and Bitcoin made the anticipated move.
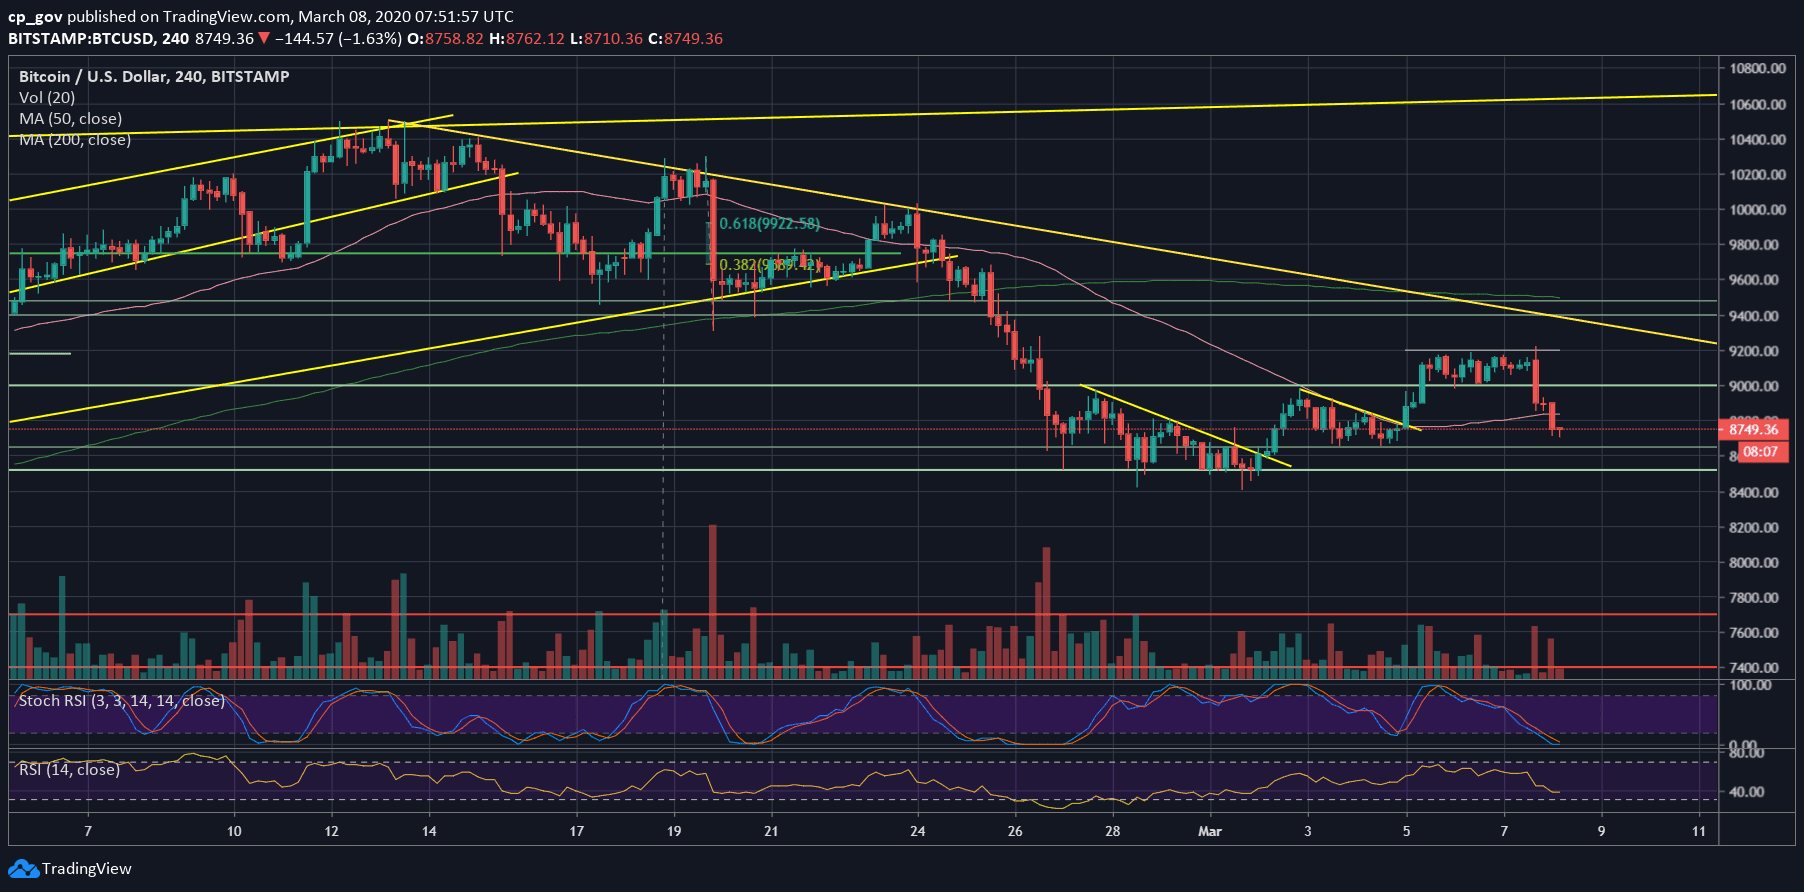
As in crypto, Bitcoin price first went to the top of the range, touched $9224 (Bitstamp), liquidated some short positions, and from there – a fatal crush of $500 which lasted for the past few hours.
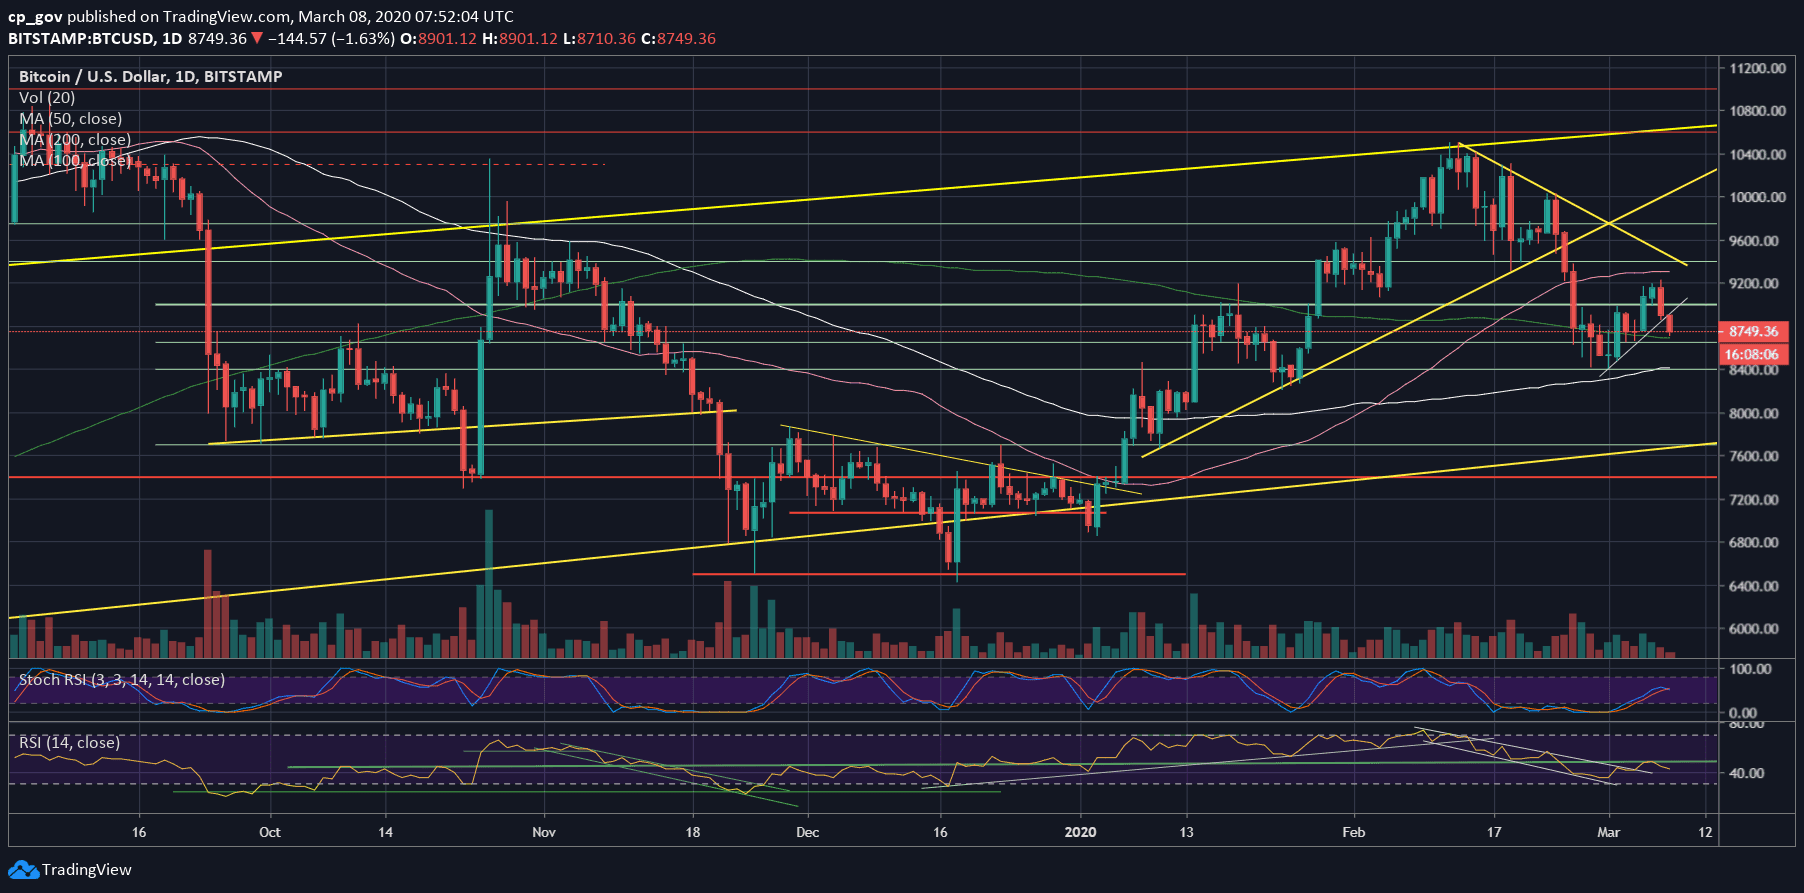
As of writing these lines, the daily low lies at $8700 (Bitstamp), and it’s not a coincidence: We had mentioned it yesterday as possible targets in case of a breakdown. This is also where lies the significant 200-days moving average line, which is marked by a light-green line on the following daily chart.
CME Futures Gap?
The recent price drop created a positive CME Futures’ gap. As we know, the CME Futures is a traditional stock exchange; hence, it has opening hours between Monday to Friday.
Those gaps tend to get filled quickly in most cases. Friday’s trading session will carry a positive gap at $9060 if things stay as is. Just to keep this in mind for Monday (tomorrow).
Total Market Cap: $251.7 billion
Bitcoin Market Cap: $160 billion
BTC Dominance Index: 63.5%
*Data by CoinGecko
Key Levels To Watch & Next Possible Targets
– Support/Resistance levels: Following the breakdown, Bitcoin is now facing the critical 200-days moving average line, or MA-200, as the first level of support at $8700.
A little below lies $8650, which is the low from the past week, and the $8500 support level, followed by $8400 (the 100-days moving average line, marked white). In case the last level breaks down, we can expect Bitcoin to retest $8000.
From above, in case BTC finds support here, the first support turned resistance level is now the $8800 area, followed by $9000 (CME’s futures gap at $9060). From above there’s yesterday’s high at $9200.
– The RSI Indicator: The breakdown is also reflected in the daily RSI. We had mentioned yesterday the decision point the RSI had to take upon consolidation at the 50 levels.
As you might have guessed, the RSI sharply corrected down towards the 42 level; this is the local low of the past week (possible support). The fact that the RSI couldn’t get over 50 is a red flag for the Bulls.
– Trading volume: The day is not over yet, but yesterday’s reversal was followed by a high amount of volume compared to the past week. However, the volume level is still far from the monthly highs.
BTC/USD BitStamp 4-Hour Chart
BTC/USD BitStamp 1-Day Chart
The post Bitcoin Price Plunges $500 Intraday, Facing Critical 200-Days MA Support: Sunday’s Price Analysis appeared first on CryptoPotato.
The post appeared first on CryptoPotato


