
After two weeks of consolidation steadily above the $7000, Bitcoin broke below. If you were following the recent price analysis posts here, you would not be surprised.
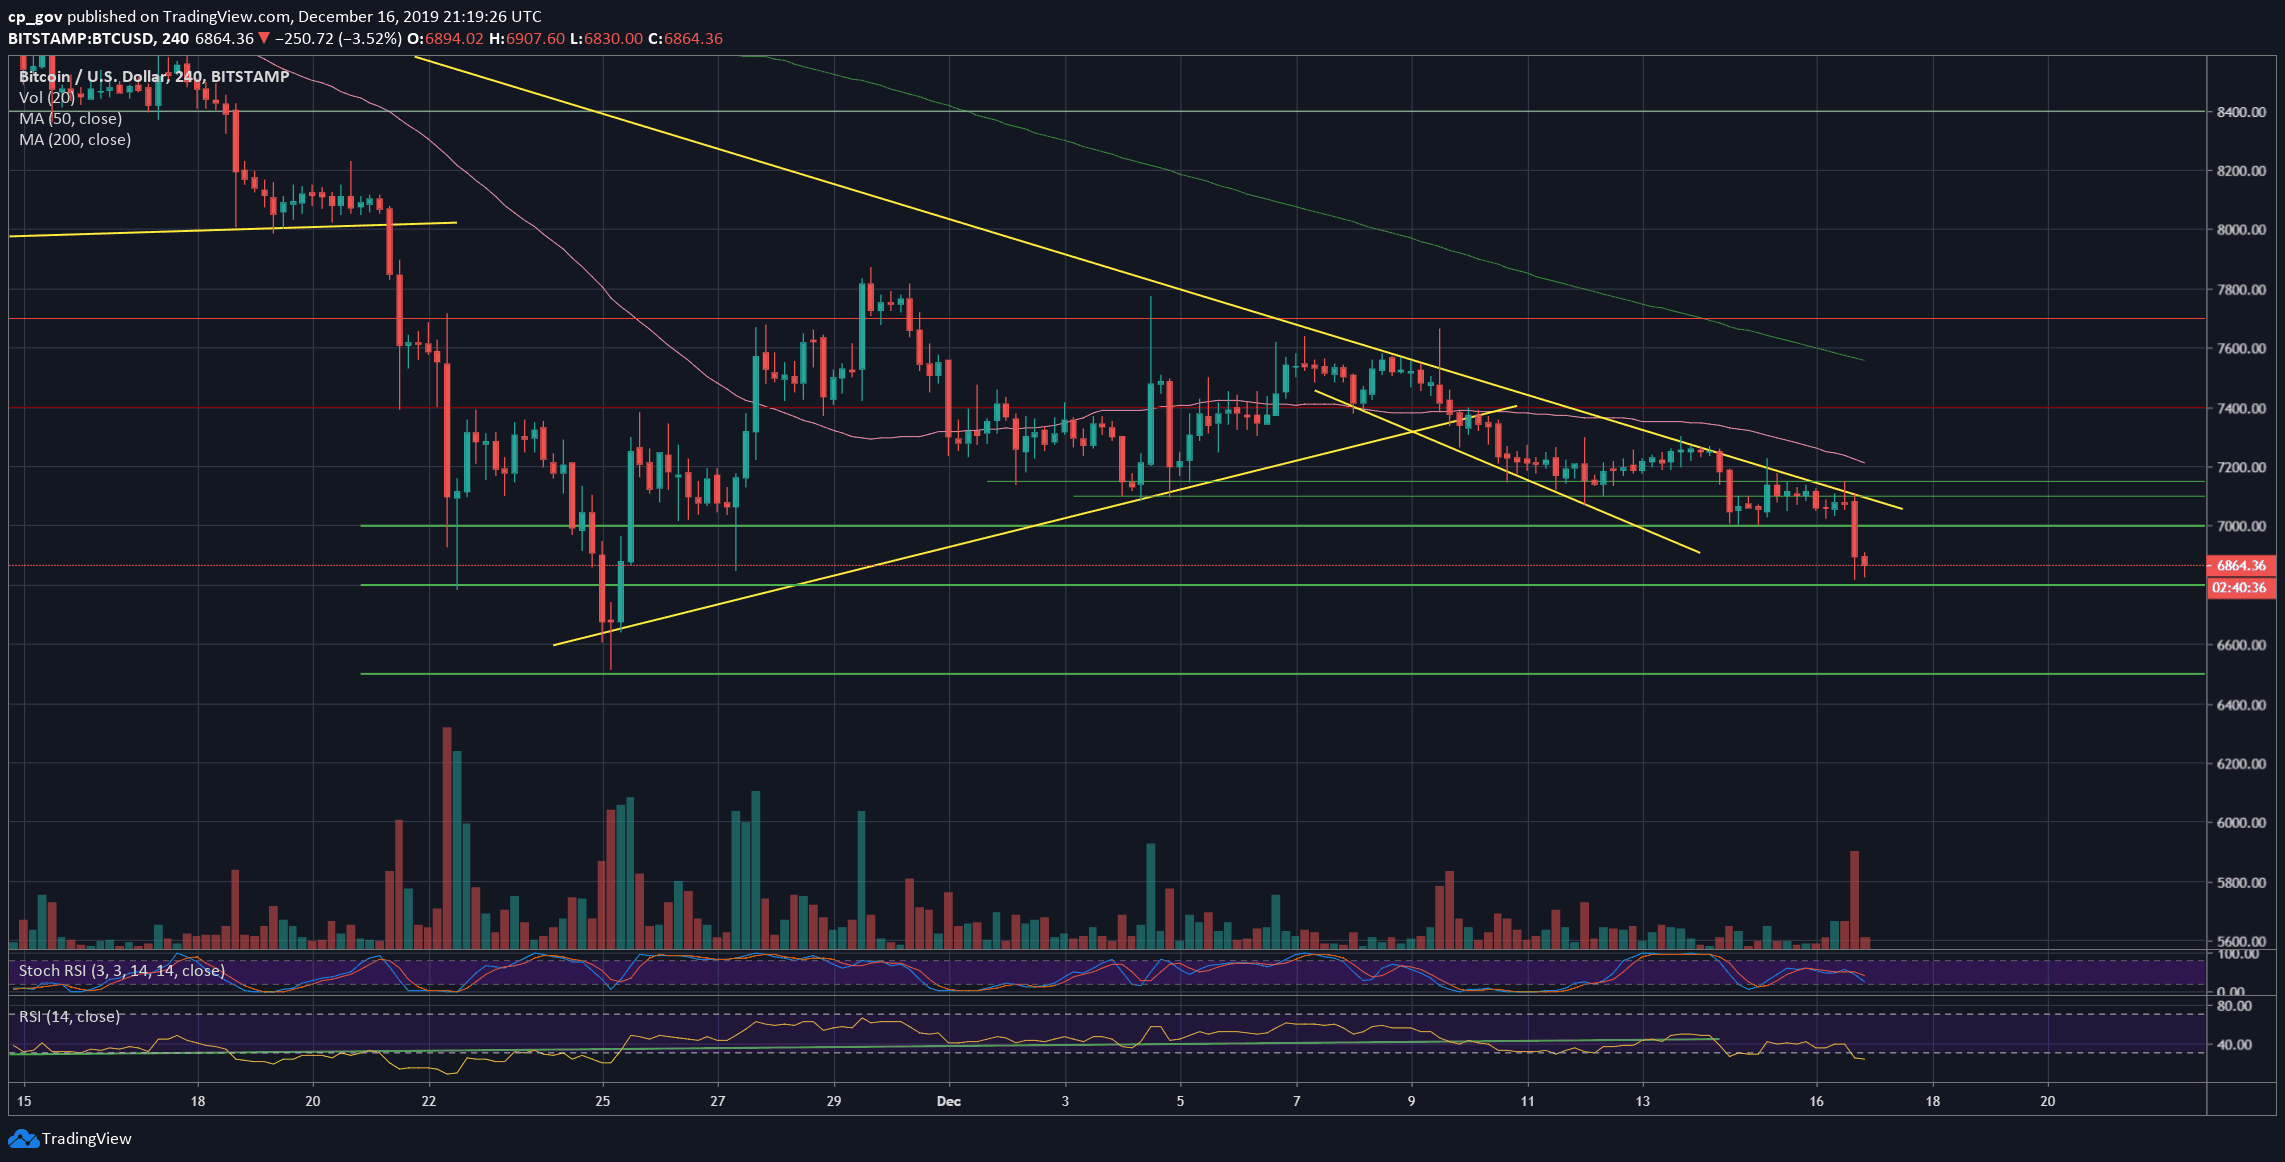
Bitcoin was showing weakness, not being able to overcome the mid-term descending trend-line (shown both on the following 4-hour and 1-day charts).
Aside from this, the long positions are mysteriously increasing to their all-time high. This is definitely not a good sign for the bulls, as they are already smelling the long squeeze.
The strange thing is that it hadn’t started yet – the longs are actually increasing even more, as Bitcoin heading towards $6800.
Another thing to note is the decreases of the altcoins in their Bitcoin’s value. As can be seen, by the Bitcoin dominance, which is rising, funds are coming out of the crypto markets (altcoins are sold to Bitcoin, and the last declines following the sell-off).
Total Market Cap: $187 billion
Bitcoin Market Cap: $125 billion
BTC Dominance Index: 66.9%
*Data by CoinGecko
Key Levels to Watch
– Support/Resistance: On the recent price analysis, we had stated that in case Bitcoin would lose the $7000 – $7100 support, it will likely go quickly to the next level at $6800. This is exactly what we see now.
$6800 is now the current daily low. Further down lies the $6500 – $6600 are, which is the low from November (and the lowest price of Bitcoin since May 2019). Below lies $6300 and $6000.
In case Bitcoin would like to retest prior resistance, then the first level of resistance is $6900 – $7000, along with the mid-term descending trend-line (the orange line from the daily chart).
Besides, as can be seen on the daily chart, Bitcoin is about to lose a long-term ascending trend-line, started forming during April 2019, unless an unexpected daily close above $6980 will take place. On November 25, Bitcoin wicked down to $6500 but closed the day above the crucial trend-line.
The next support turned resistance level is the $7300 – $7400 price area.
– The RSI Indicator: There is no change from our previous analysis. The momentum indicator points down and looks very bearish. There is still more room to go down by looking at the RSI.
– Trading volume: Finally, some volume. This could be the highest volume day of the past ten days. There are still few hours until the daily volume candle closes.
BTC/USD BitStamp 4-Hour Chart
BTC/USD BitStamp 1-Day Chart

Disclaimer: Information found on CryptoPotato is those of writers quoted. It does not represent the opinions of CryptoPotato on whether to buy, sell, or hold any investments. You are advised to conduct your own research before making any investment decisions. Use provided information at your own risk. See Disclaimer for more information.
Cryptocurrency charts by TradingView.
Technical analysis tools by Coinigy.
You might also like:
The post appeared first on CryptoPotato


