
Investment has been pouring back into the global crypto market and Bitcoin consistently now since August 27, from a low of $348 billion to its current peak at $387 billion – according to data from Coinmarketcap.
This influx of capital has helped the leading crypto’s price climb over $800 from it’s monthly low at $11,115, just four days ago, and is now driving BTC back up towards that all-important $12,000 level.
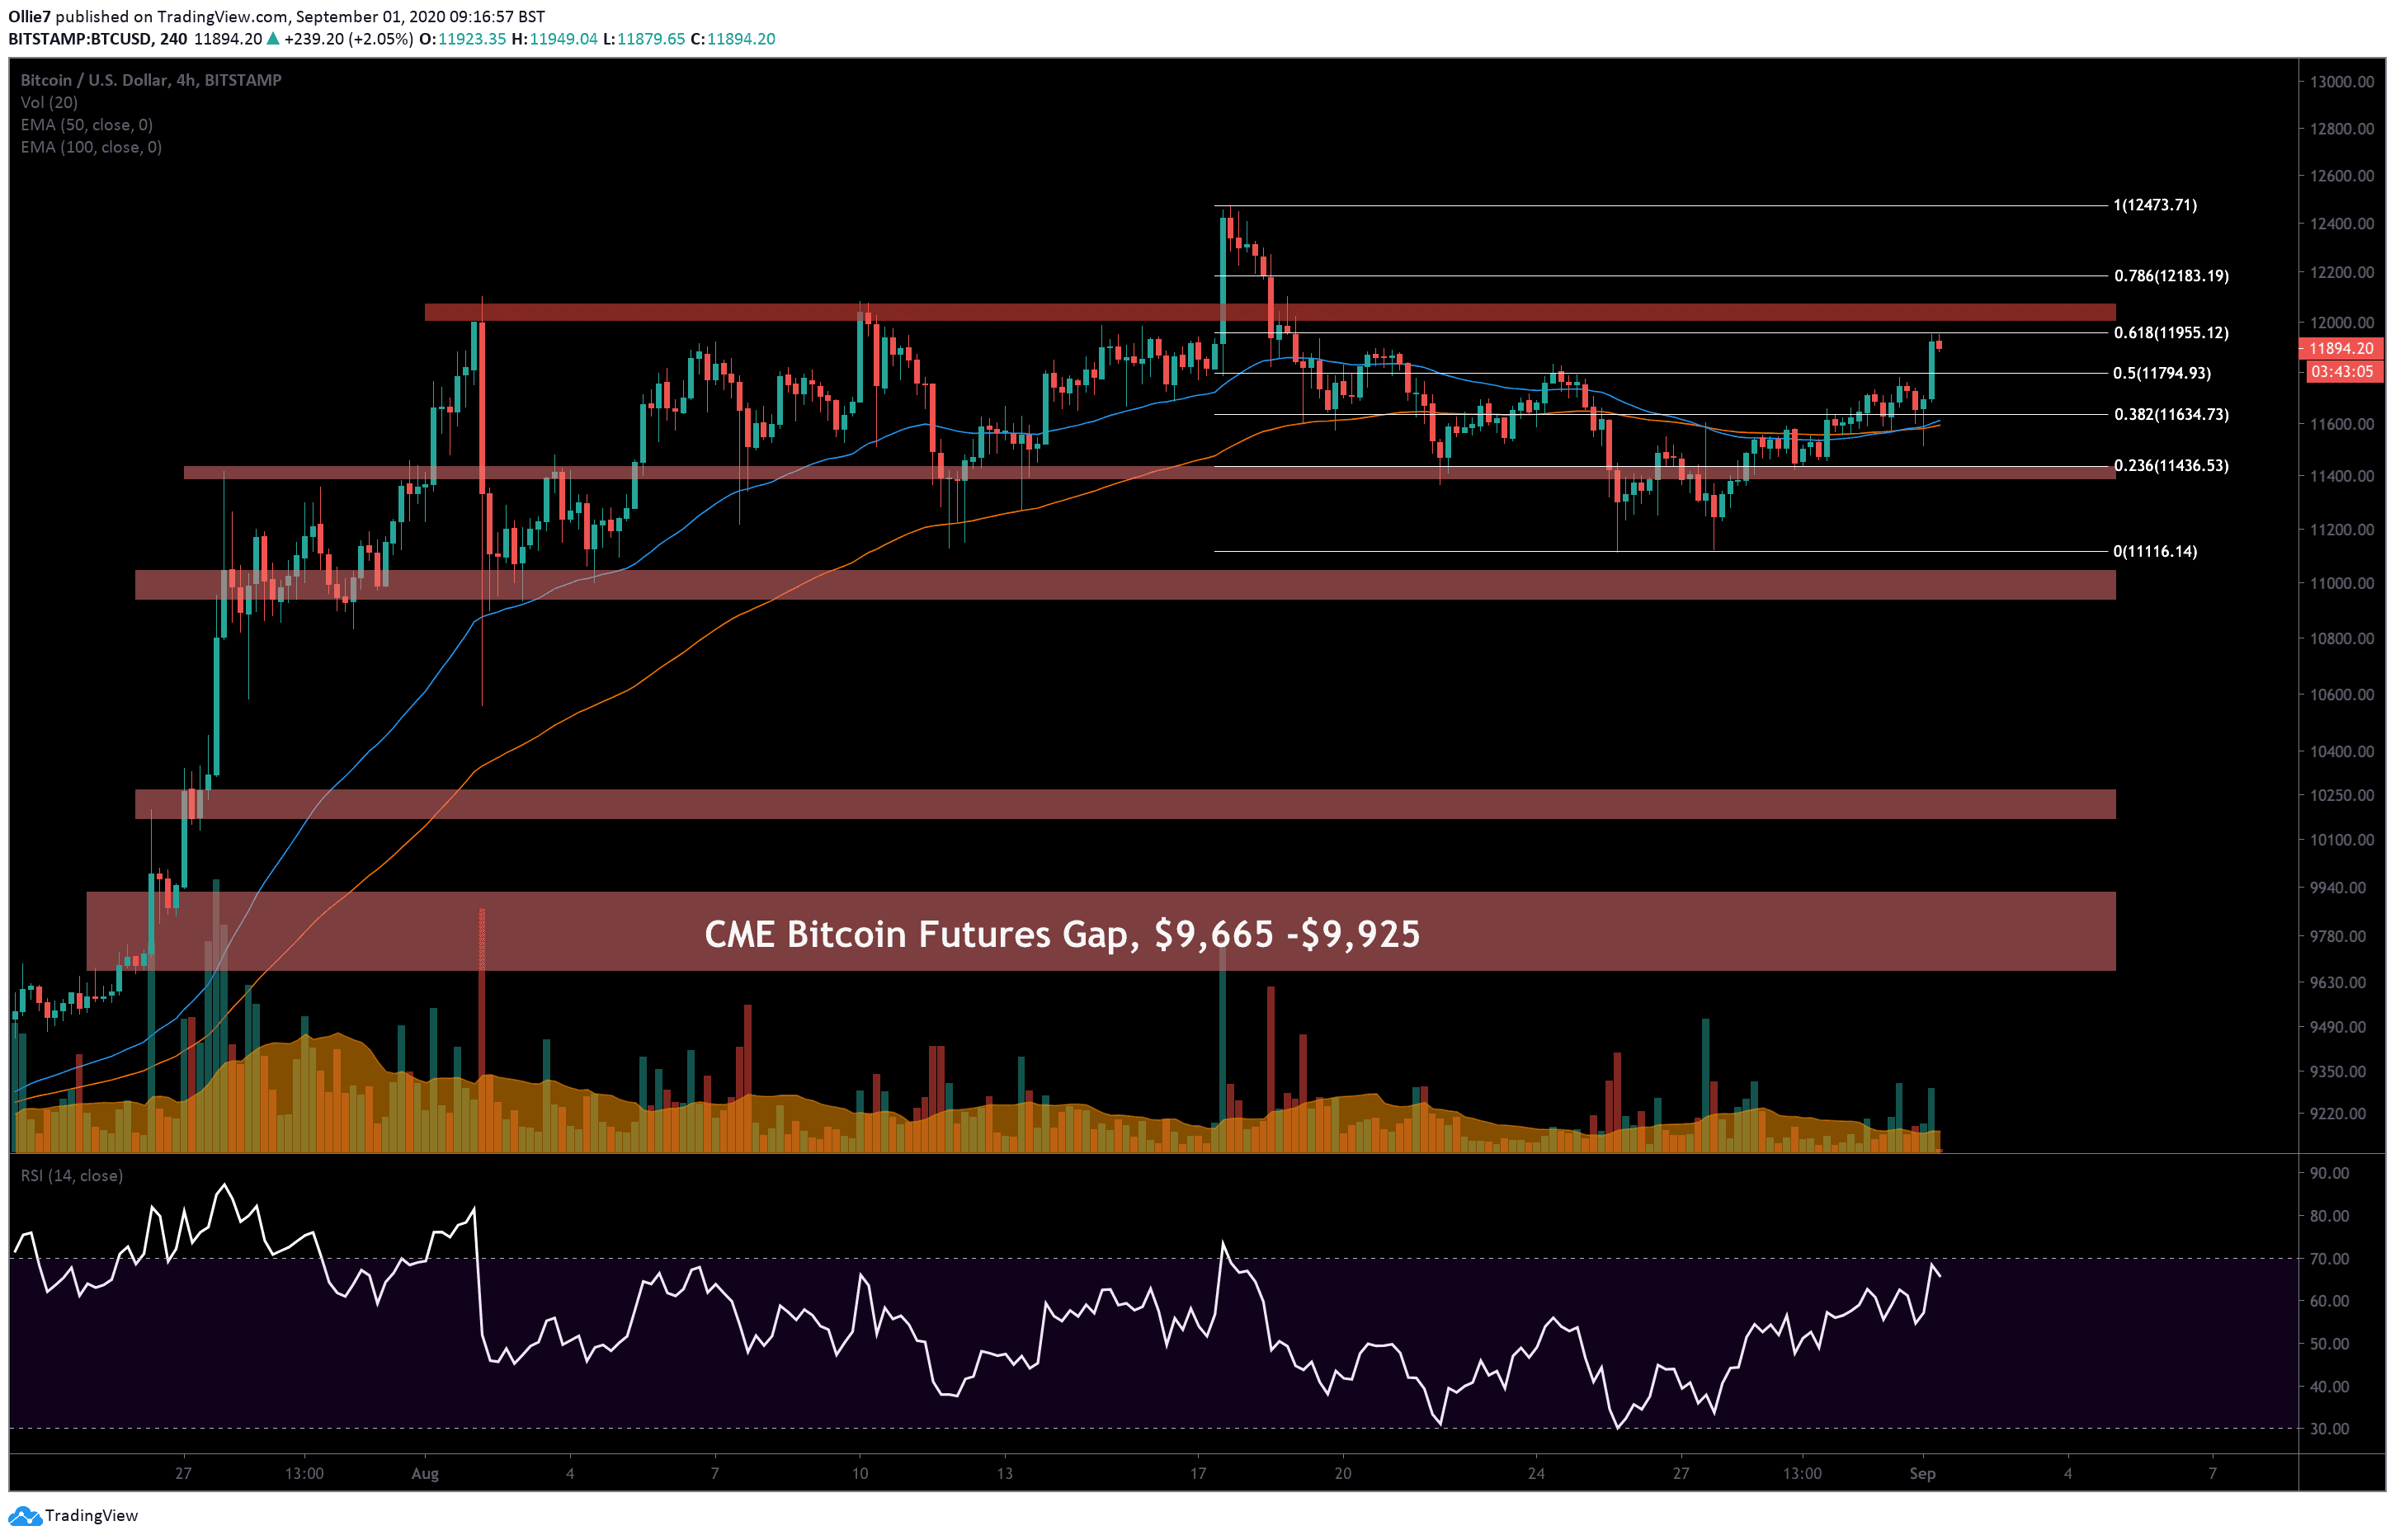
Today, BTC has successfully broken out of the tight Fibonacci range it was trapped in over the last 48 hours, between the 0.382 and 0.5 levels – $11,634 and $11,794, respectively – and surged 2.3% to the next 0.618 Fibonacci resistance before correcting.
Is this latest burst the start of a new bull run that will see BTC print a new YTD high, or is this just another orchestrated whale pump and dump pattern to shake out weak hands? Let’s take a look.
The Technicals: Bullish
Looking at the 4-hour BTC/USD chart, we can see that the 50 and 100 EMA lines (blue and red respectively) have bullishly converged back over one another, after briefly flipping bearish on August 27. This suggests short-term momentum is favoring bullish traders right now in the market.
Parabolic SAR dots are now also appearing back underneath the trend, which is also a promising sign for the current trend.
The only concern now is that BTC is quickly approaching the overbought region on the RSI which could create some selling pressure as trading bots get triggered and dump on the market.
Price Levels to Watch in the Short-term
Right now, prices are stuck beneath the strong 0.618 Fibonacci resistance at $11,955. This level hasn’t been broken in over two weeks and is the key area that bullish traders will need to overcome in the short-term in order for a continuation to happen.
Looking above this, we obviously have the psychological $12,000 level (red zone), the YTD-high at around $12,400, and a weekly resistance at $12,800 as the next likely areas of resistance.
If momentum wanes, or this uptrend does turn out to be a whale manipulation pattern, then we should anticipate a sharp decline back down to the 0.382 Fibonacci level at $11,634. From there, we could see more sideways activity and potentially a drop to the more substantial Fibonacci support below at $11,436, before a recovery.
Total market capital: $400 billion
Bitcoin market capital: $219 billion
Bitcoin dominance: 54.9%
*Data by Coingecko.
Bitstamp BTC/USD 4-Hour Chart
Click here to start trading on BitMEX and receive 10% discount on fees for 6 months.
Disclaimer: Information found on CryptoPotato is those of writers quoted. It does not represent the opinions of CryptoPotato on whether to buy, sell, or hold any investments. You are advised to conduct your own research before making any investment decisions. Use provided information at your own risk. See Disclaimer for more information.
The post appeared first on CryptoPotato


