
Bitcoin price is slowly declining and recently tested $7,100 against the US Dollar.The price is currently recovering, but likely to face hurdles near $7,280 and $7,320.There was a break above a major bearish trend line with resistance near $7,185 on the hourly chart of the BTC/USD pair (data feed from Kraken).The pair might slide further towards $7,000 unless there is a break above the $7,320 resistance.Bitcoin price is struggling to hold key supports against the US Dollar. BTC remains at a risk of more downsides towards $7,000 and $6,880 before a decent upward move.Bitcoin Price AnalysisIn the past few sessions, there was a steady decline in bitcoin price below the $7,320 support against the US Dollar. Moreover, BTC settled below $7,320 and the 100 hourly simple moving average.The recent decline was such that the price even traded below the $7,200 and $7,150 support levels. A new weekly low is formed near $7,109 and the price is currently correcting higher above $7,150.Besides, there was a break above a major bearish trend line with resistance near $7,185 on the hourly chart of the BTC/USD pair. Bitcoin price is now trading near the 23.6% Fib retracement level of the downward move from the $7,531 high to $7,109 low.It seems like there is a short term ascending channel forming with resistance near $7,250. The first key resistance is near the $7,275 level and the 100 hourly simple moving average.The next major resistance is near the $7,320 level. Additionally, the 50% Fib retracement level of the downward move from the $7,531 high to $7,109 low is near the $7,320 resistance area.A successful close above the $7,320 resistance might set the pace for a strong upward move. In the mentioned case, the price might continue to rise towards the $7,400 and $7,500 resistance levels.On the other hand, the price might fail to continue higher above $7,275 and $7,320. In this bearish case, the price might extend its decline below $7,150. An immediate support is near the $7,100 area, below which there is a risk of a breakdown below $7,000.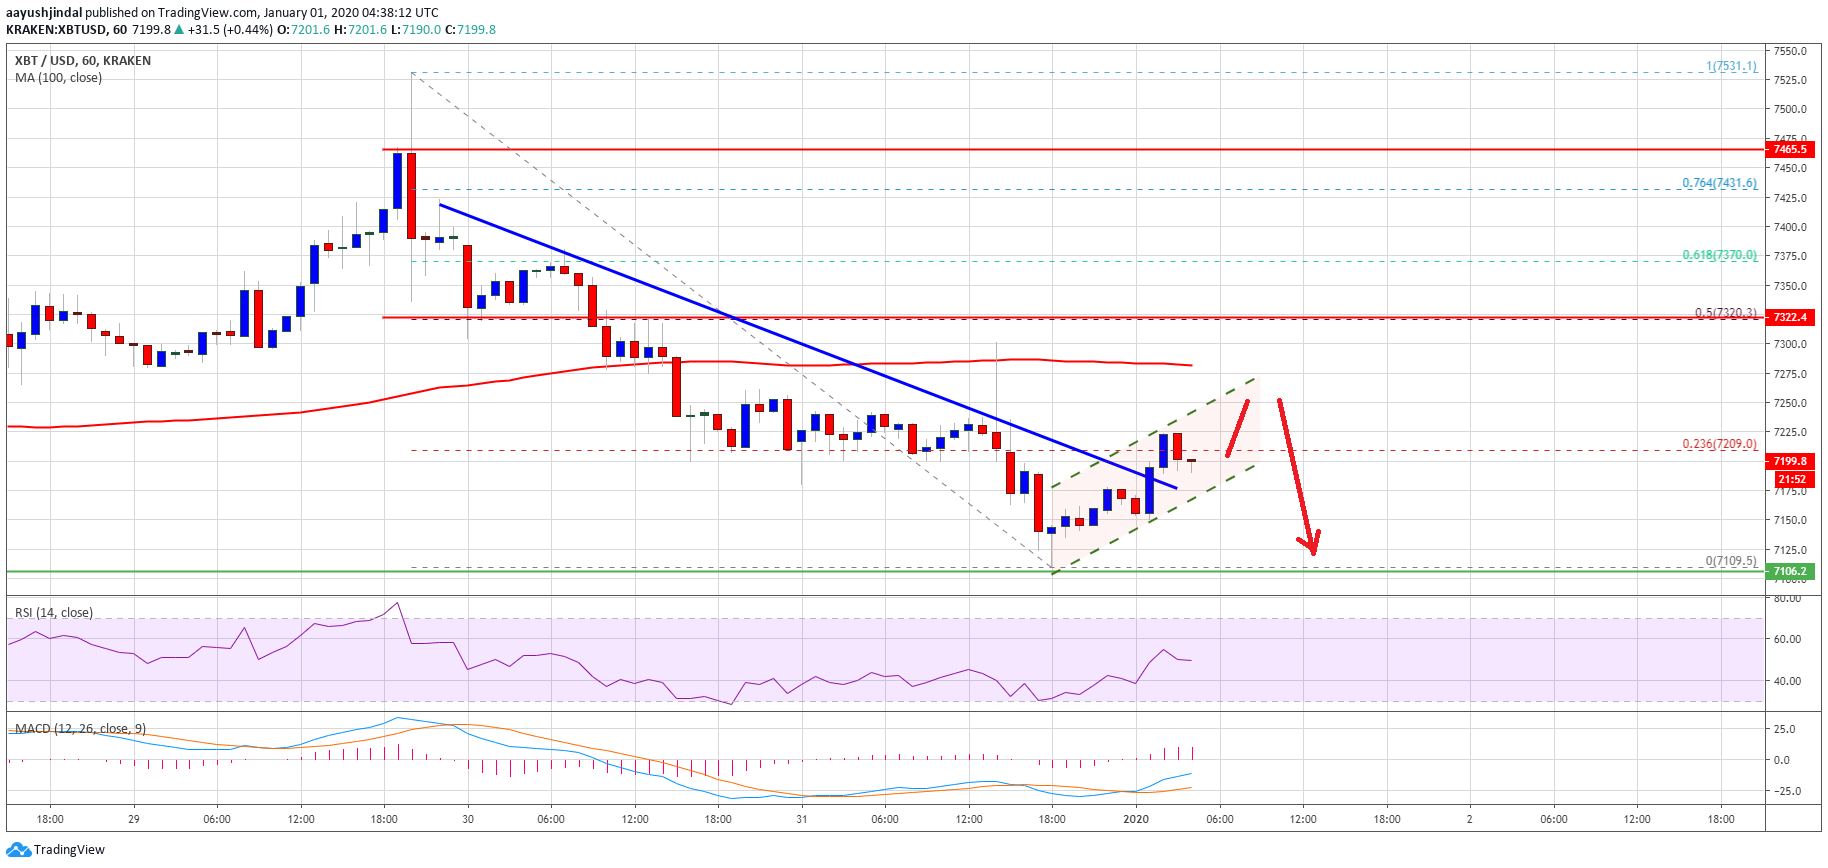 Bitcoin PriceLooking at the chart, bitcoin price is showing bearish signs below the $7,320 level and the 100 hourly SMA. Therefore, there are chances of more losses this week unless the bulls push the price above $7,320.Technical indicators:Hourly MACD – The MACD is currently moving in the bullish zone.Hourly RSI (Relative Strength Index) – The RSI for BTC/USD is now just below the 50 level.Major Support Levels – $7,100 followed by $7,000.Major Resistance Levels – $7,275, $7,320 and $7,500.The post appeared first on NewsBTC


