
Bitcoin’s dominance was noted to be around 65.27% at press time, after a drop from 65.99%. A rise in the said metric, alongside an appreciating Bitcoin, is generally an indication of losses in the altcoin market.
Both Bitcoin SV and Ontology looked to be heading south on the charts. BSV was unable to breach a level of resistance while ONT formed a bearish reversal pattern that could undo its gains over the past week. Finally, Maker hinted at a bullish breakout but its price action invalidated the pattern.
Bitcoin SV [BSV]
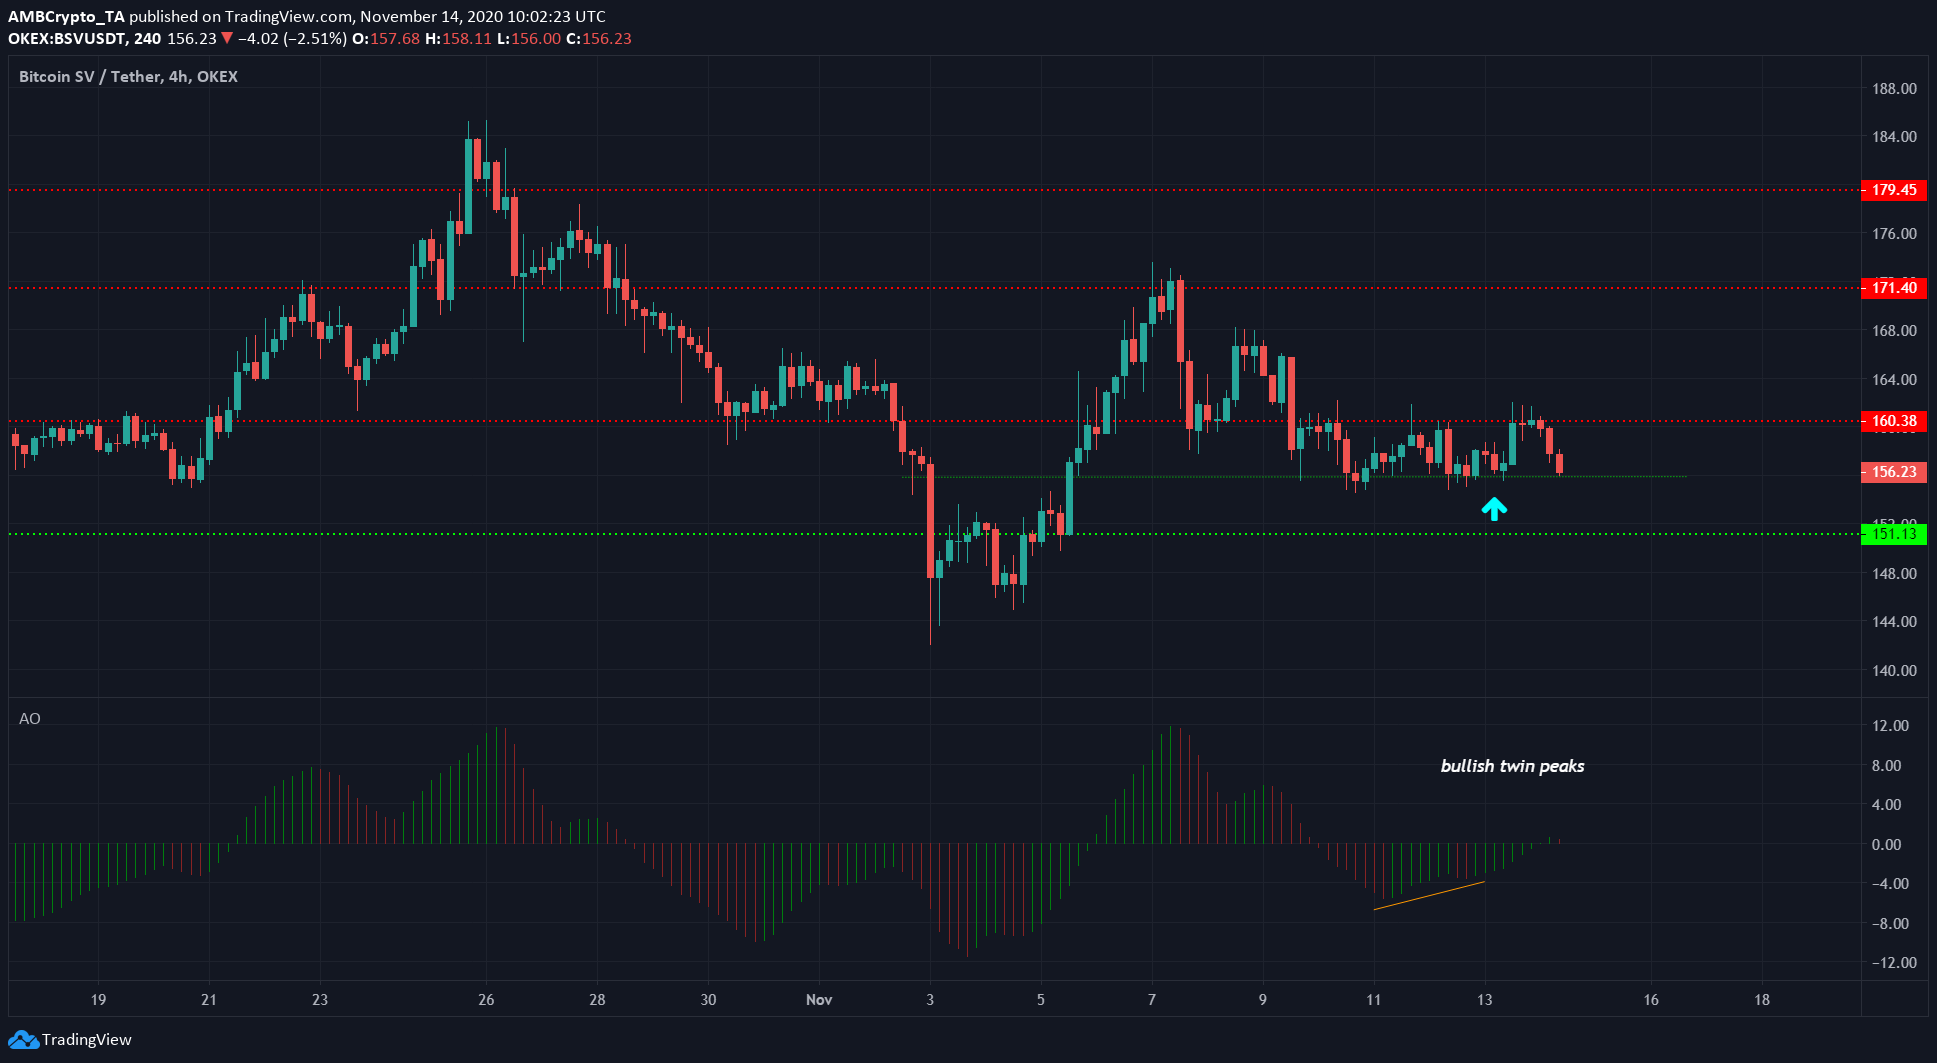
Source: BSV/USDT on TradingView
BSV exhibited a bullish twin peaks setup on the Awesome Oscillator and saw a bounce from $155.9 to $161.6. However, the bears stepped in and pushed the price back under the resistance level on the charts.
At the time of writing, BSV was heading south again, with the support levels observed to be at $155.9 and $151.13.
The past week also saw the price oscillate between the $160 and $156-levels, suggesting that a break out of the range could initiate a short-term trend. Hence, a break down could see BSV drop to as low as $144.
Ontology [ONT]
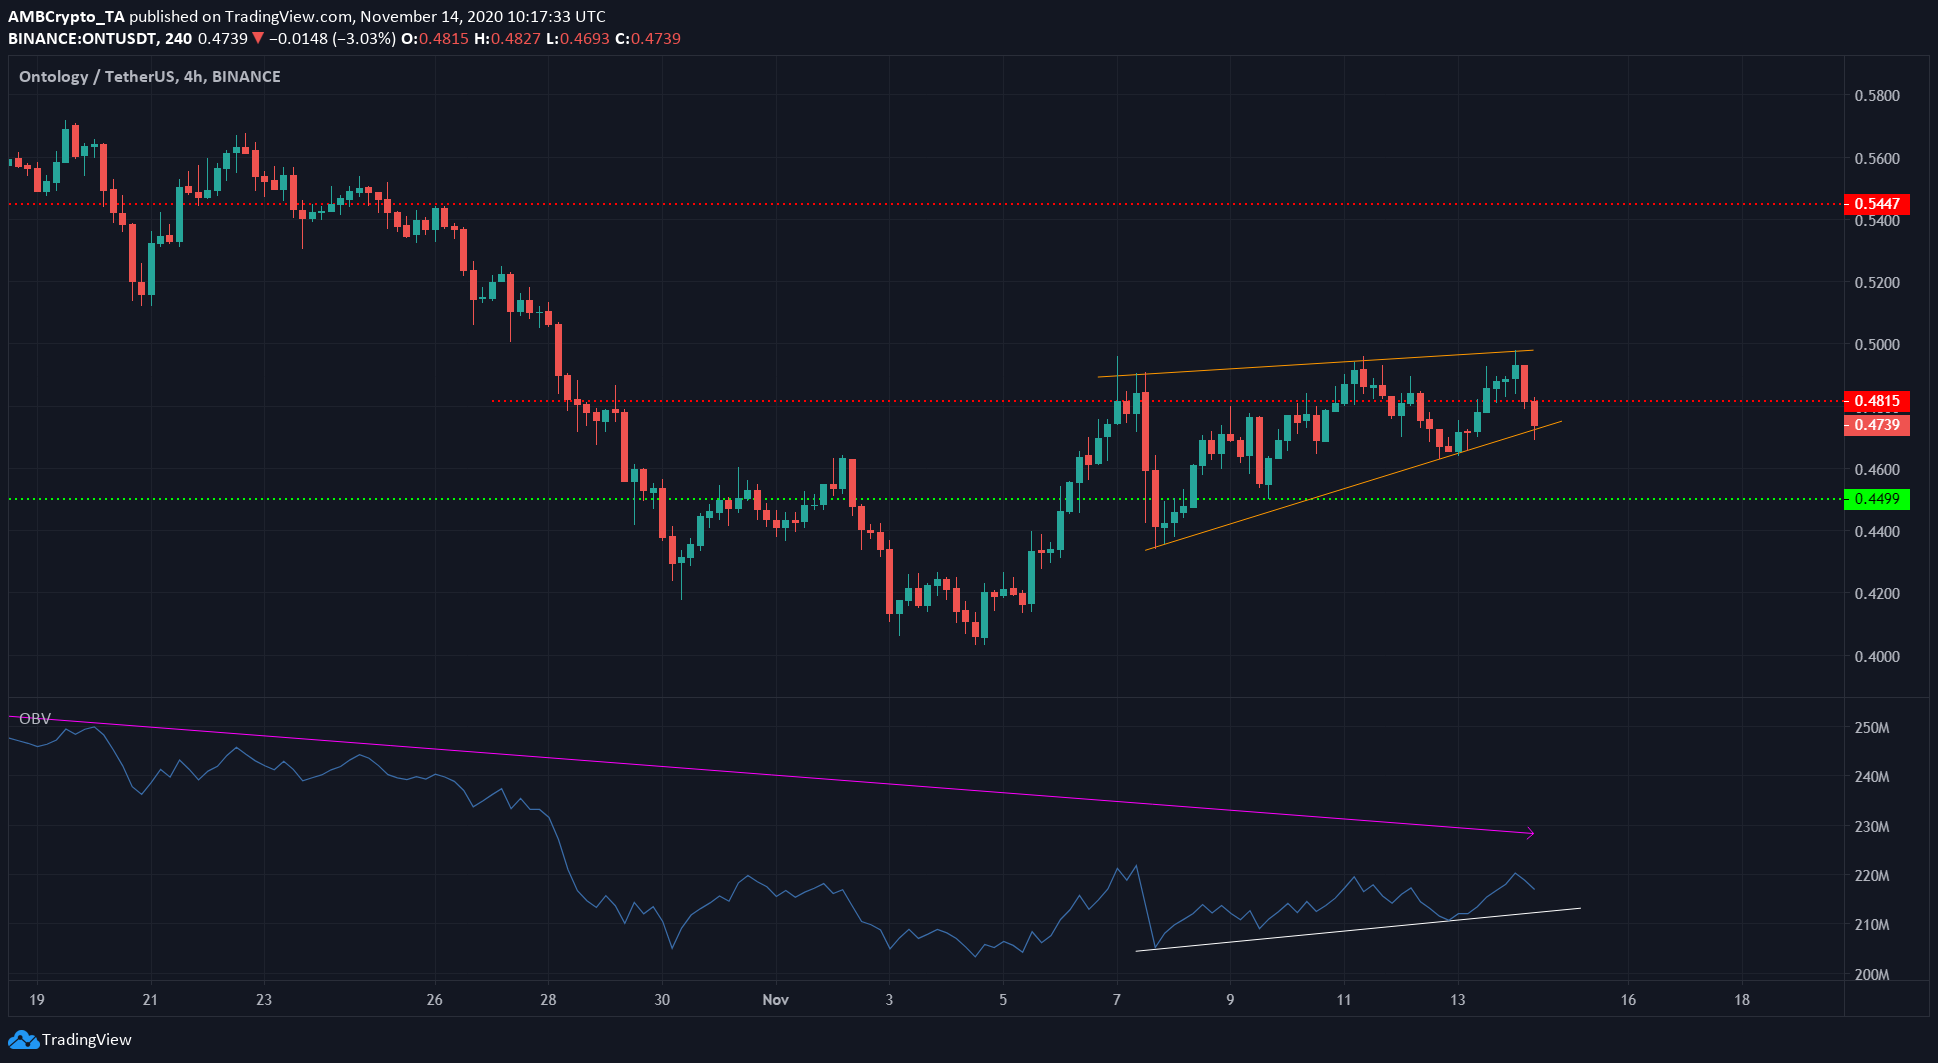
Source: ONT/USDT on TradingView
Ontology formed a rising wedge (orange), a pattern that should see its recent bounce reversed. A close under the pattern on good trading volume would see ONT drop towards $0.42 once more.
The OBV highlighted that even though buying volume was on the rise over the past few days, the selling volume has dominated over the past couple of months. This hinted at the continuation of the prior trend since the long-term trend is generally stronger.
Maker [MKR]
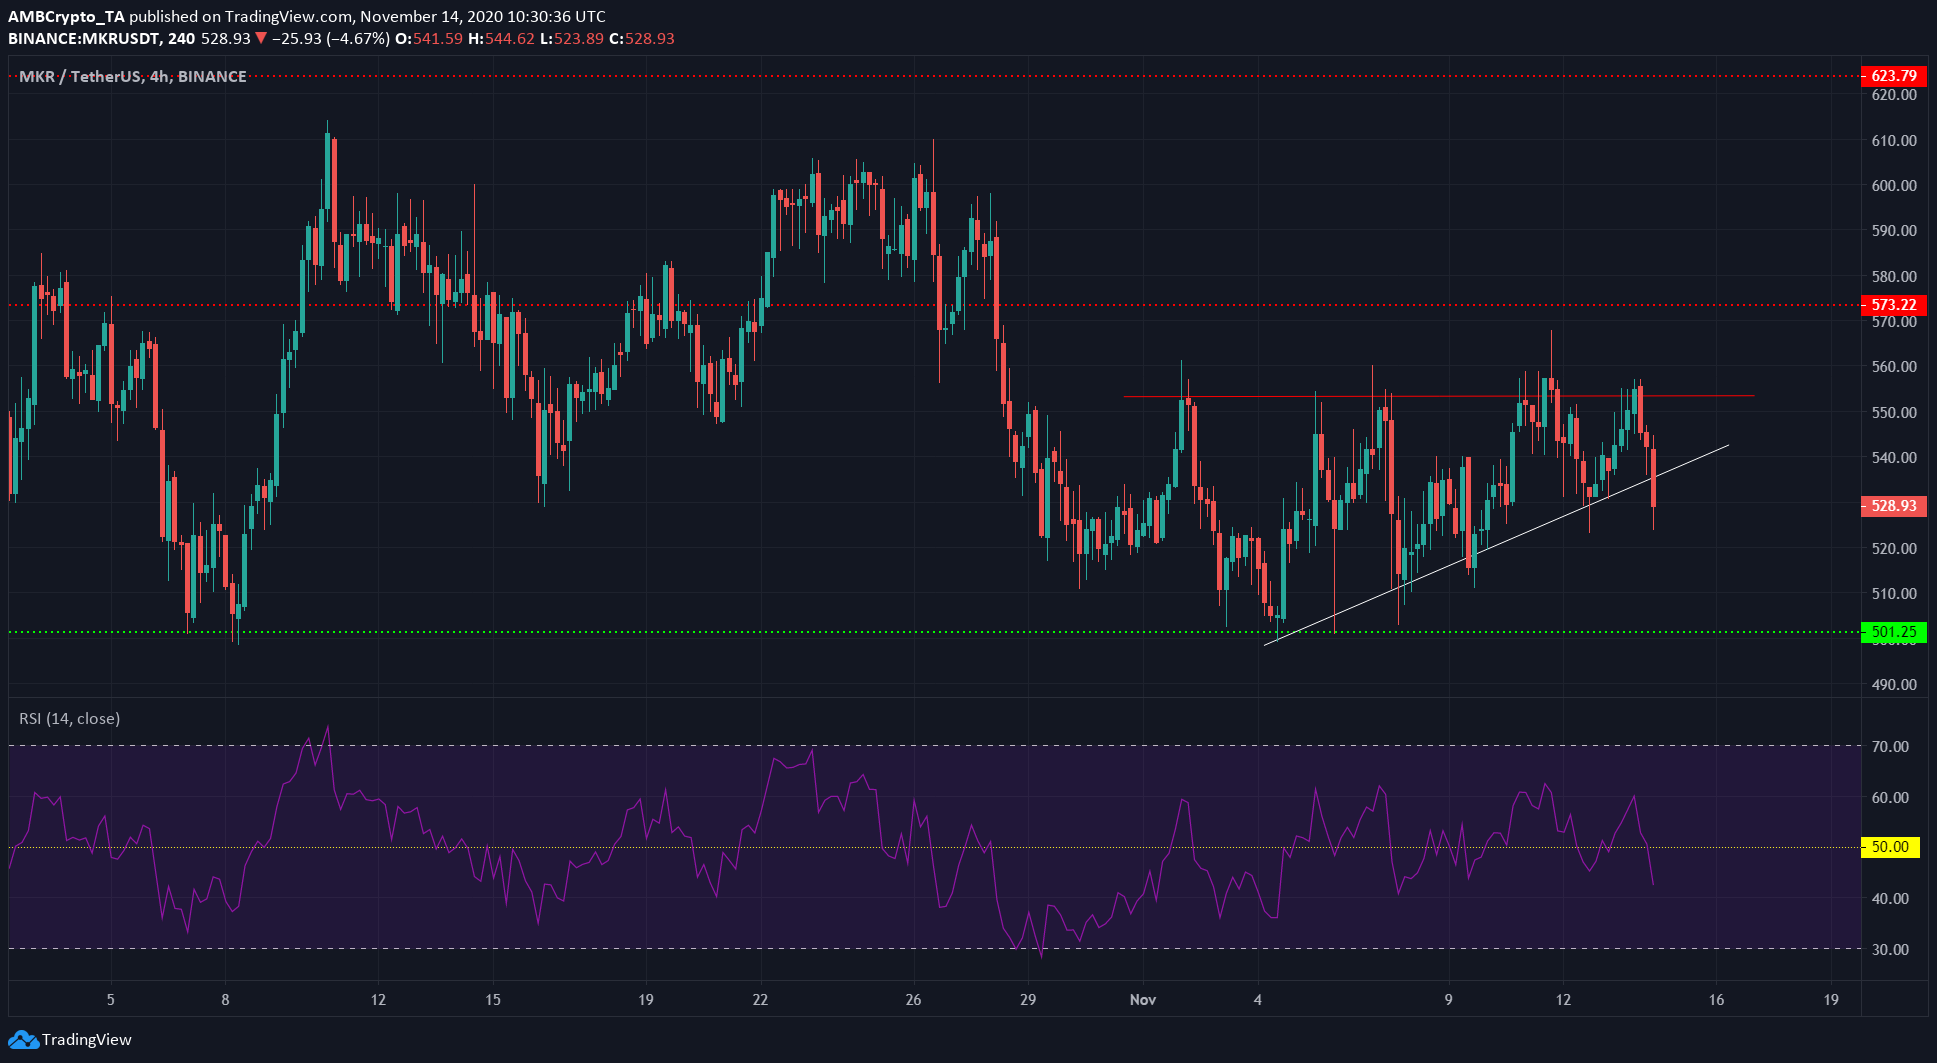
Source: MKR/USDT on Tradingview
MKR’s price has been quite volatile in recent days. However, a pattern had emerged on the charts. The trendline (white) with MKR’s higher lows formed an ascending triangle with the resistance at $550.
But, this pattern was likely invalidated after the price dropped right past the ascending trendline on the charts. MKR, therefore, was unlikely to be pushed up the charts to close within the pattern.
This development could see MKR visit the support level around $500 once again.
The post appeared first on AMBCrypto


