
- While Bitcoin continues to remain indecisive, BSV rallied 15.22% to stay above $300
- Bitcoin SV signals bullish with triangle breakout across its trading pair.
Key Support Levels: $423, $458
Key Resistance Levels: $288, $236
BSV/USD: Following Latest Triangle Break, Bitcoin SV Is Poised For A Huge Gain
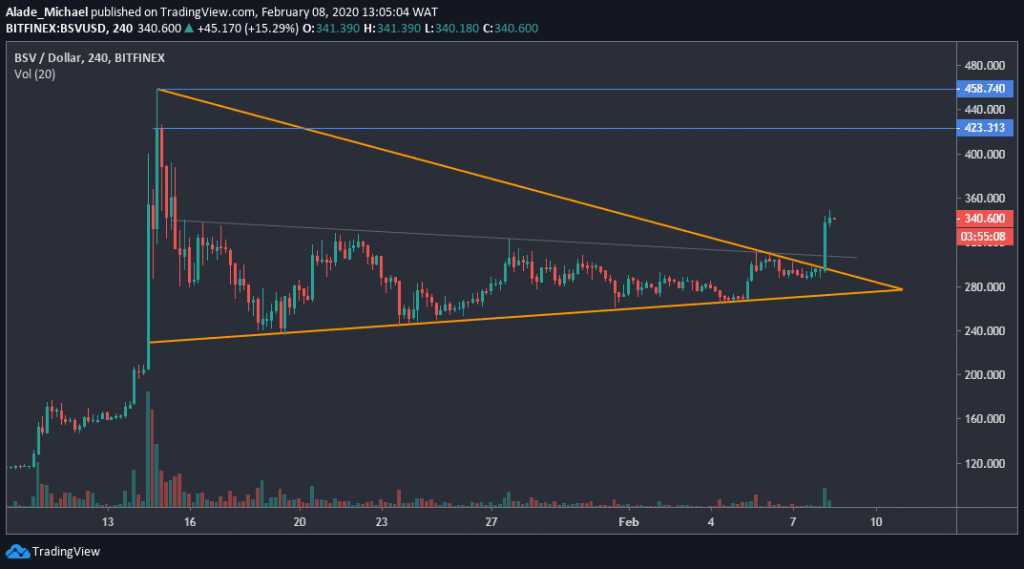
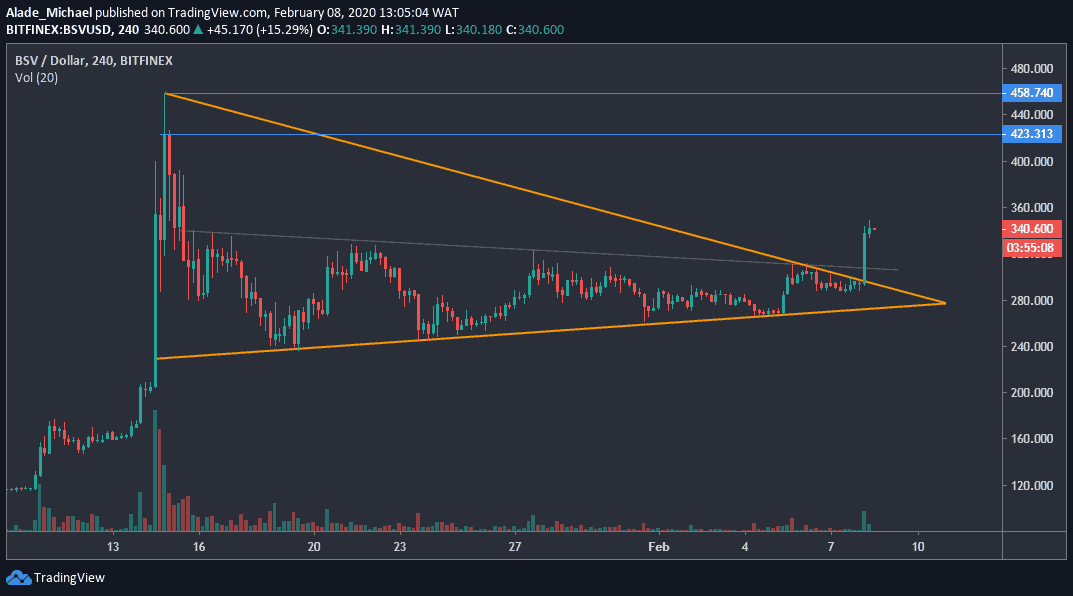
BSV/USD. Source: TradingView
In early January, Bitcoin SV displayed an impressive performance following an epic surge from $90 to $458 against the US Dollar. This surge amounted to about 500% ROI in two weeks. After the huge pump, BSV saw a 50% downward correction in a three weeks triangle pattern.
Today, BSV broke out from this triangle after seeing a sudden price increase of 15%. For this reason, the price of BSV has soared to around $340 at the moment as buyers regroup for more setups.
At the time of writing, BSV remains the 5th largest coin by market cap valuation of $6.18 billion. Considering the latest breakout, it’s important to note that Bitcoin SV is starting another bullish cycle.
Bitcoin SV Price Analysis
Over the past hours, Bitcoin SV saw a sharp break from a three weeks triangle pattern. This bullish move is currently supported by $288 after witnessing a healthy correction to around $236 on January 19. Apart from these key support levels, BSV is further supported at $307 – where the grey line lies.
In case of a slight pullback, this grey line could provide a rebound level for BSV. The price range for this breakout is projected at $423 and $458, where the blue resistance line is drawn. If BSV touches these price lines and advances higher, the next resistance to watch out for is $500.
A slump beneath $300, however, could reintroduce the sellers back in the market. Looking at the 4-hours time frame, it appeared clearly that buyers are returning to the market.
BSV/BTC: BSV Bulls Targeting 0.038SAT Level After Surging 16.68%

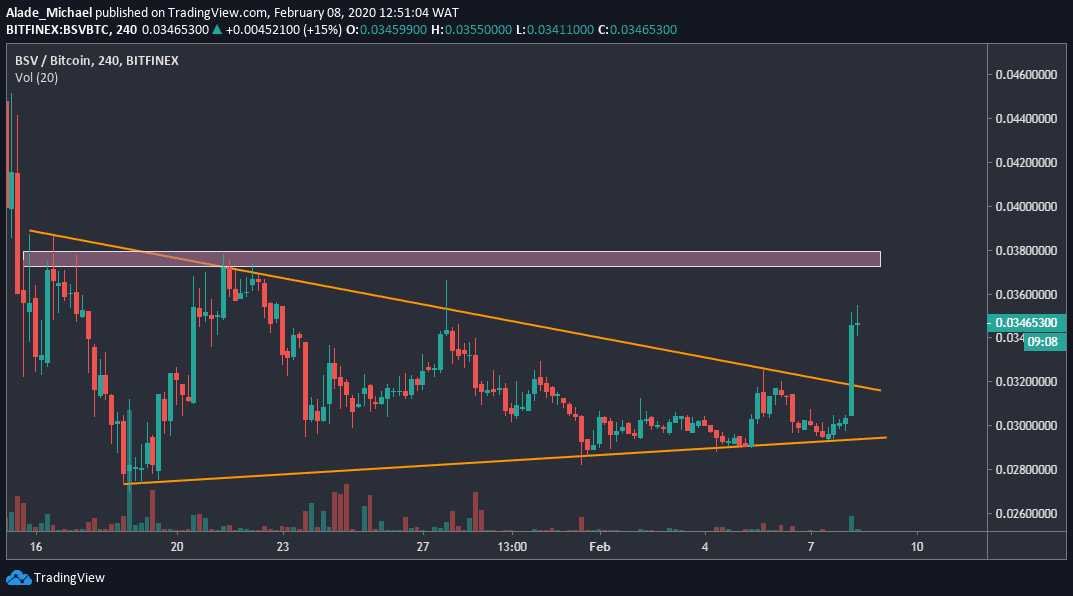
BSV/BTC. Source: TradingView
Bitcoin SV has also regained momentum against Bitcoin. Following a similar pattern as with US Dollar pair, the price of BSV is now roaming around 0.0348SAT price level after seeing a quick gain of 16.68% a few hours ago. This recent price change has simultaneously led to a triangle breakout on the 4-hours chart. The bulls are now showing interest in the market.
Against Bitcoin, BSV is now holding a market cap valuation of 637,275 Bitcoin and a 24-hours trading volume of 341,834 Bitcoin at the moment.
If the buyers can act upon the current breakout, characterized by a bullish engulfing candle, we can expect more green momentum to follow the course. Currently, BSV looks bullish on the price chart as more buying pressure is expected to play out in the future.
Bitcoin SV Price Analysis
After reaching a tight angle, Bitcoin SV violently surges away from a triangle that trapped price action for the past few days. This breakout is an indication of a change in trend. As we can see on the chart, BSV is preparing for a new bullish rally, aimed at a short-term resistance area of 0.038SAT.
Once BSV manages to claim the mentioned resistance, the next buying target to keep an eye on is 0.044SAT level, followed by an immediate resistance of 0.046SAT level. Though, BSV volume is still pretty low on the 4-hours chart.
If the price retraces a bit, the market may provide another buying opportunity for traders around the 0.032SAT support area before rallying up. Meanwhile, there’s significant support at 0.029SAT level, which appeared as the last defense line for the short-term bears. As it is now, a new bullish sentiment is slowly underway.
Disclaimer: Information found on CryptoPotato is those of writers quoted. It does not represent the opinions of CryptoPotato on whether to buy, sell, or hold any investments. You are advised to conduct your own research before making any investment decisions. Use provided information at your own risk. See Disclaimer for more information.
The post appeared first on CryptoPotato


