
Yesterday, Bitcoin closed another weekly candle – the first week of June. During the past week, the price had gone through extreme volatility ($9100 – $10,500); however, there is good and bad news following the weekly close.
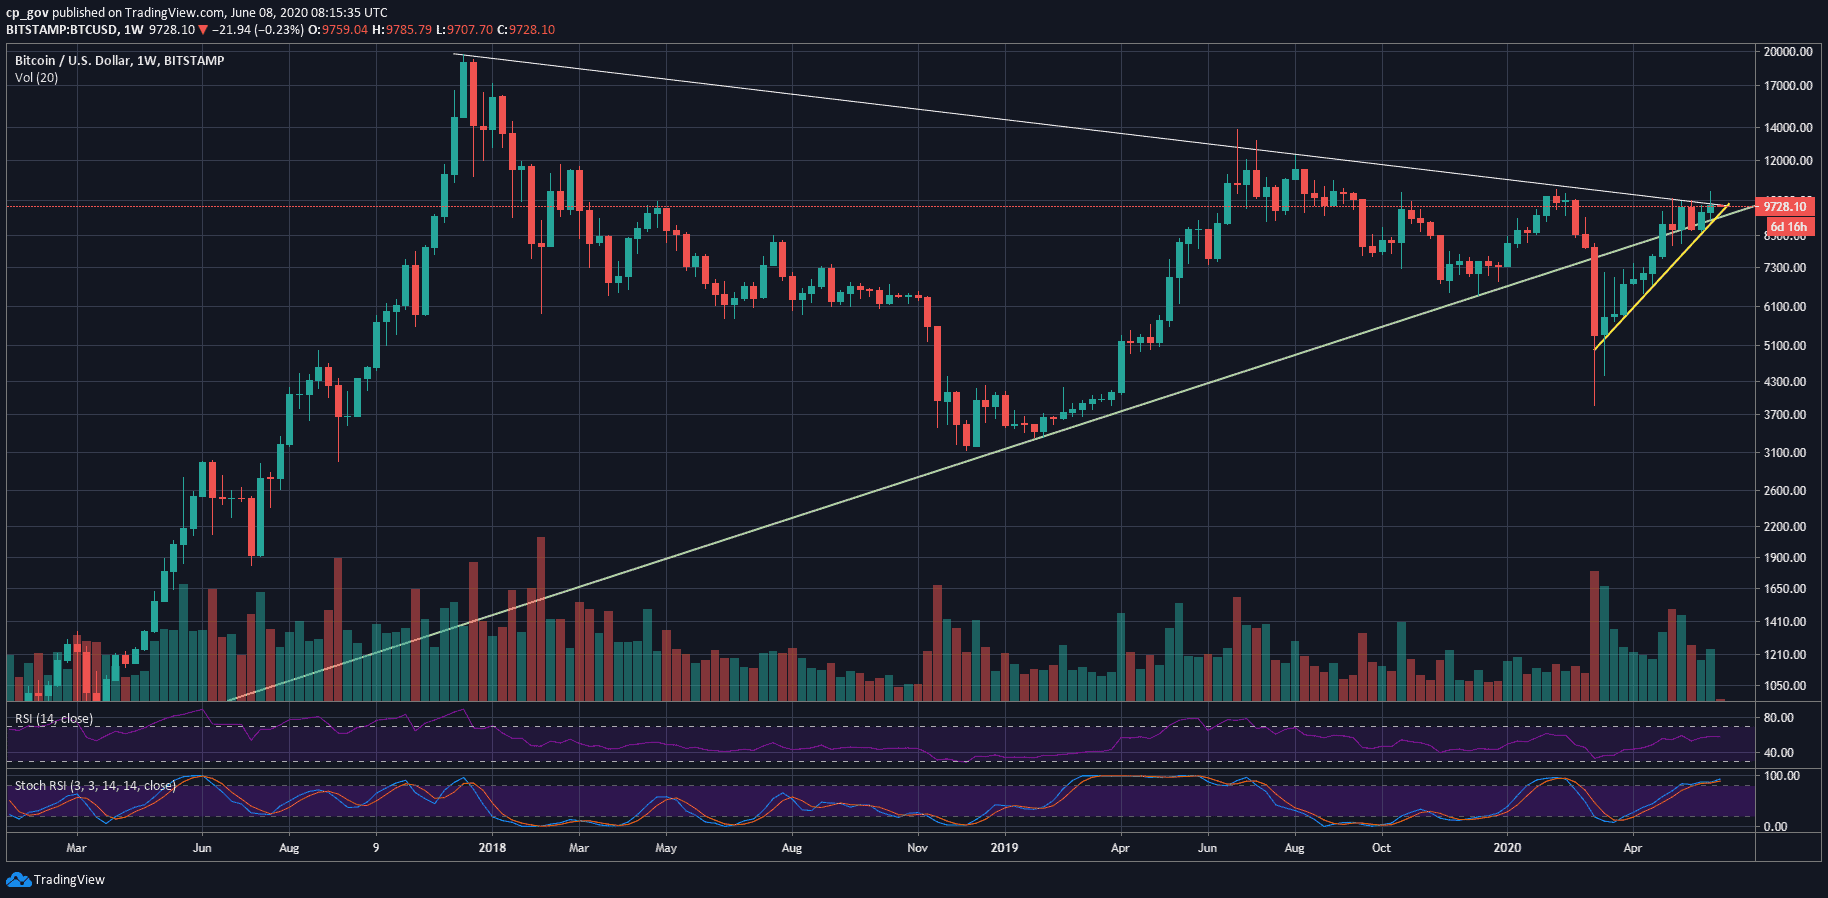
The good news is that the weekly candle ended green while holding the long-term support at the ascending line started forming in January 2015. The weekly low was $9135 on Bitstamp, as seen on the following chart.
The bad news is that the weekly candle could not close above the long-term descending resistance line, which started forming on December 2017 (Bitcoin’s all-time high).
As can be seen in the following weekly chart, this week’s candle could be critical for the price of Bitcoin in the short-term.
Bitcoin will look to break the crucial level of resistance between $9800 – $10,000 and surpass 2020 high at $10,500. This will be the perfect sign that the bulls are in control.
On the other hand, Bitcoin would like to maintain the $9200 – $9300 support area and not close this week’s candle below it.
The above is a macro-level analysis. Keep on reading for the micro support and resistance levels.
BTC/USD BitStamp 1-Week Chart
Key Support and Resistance Levels
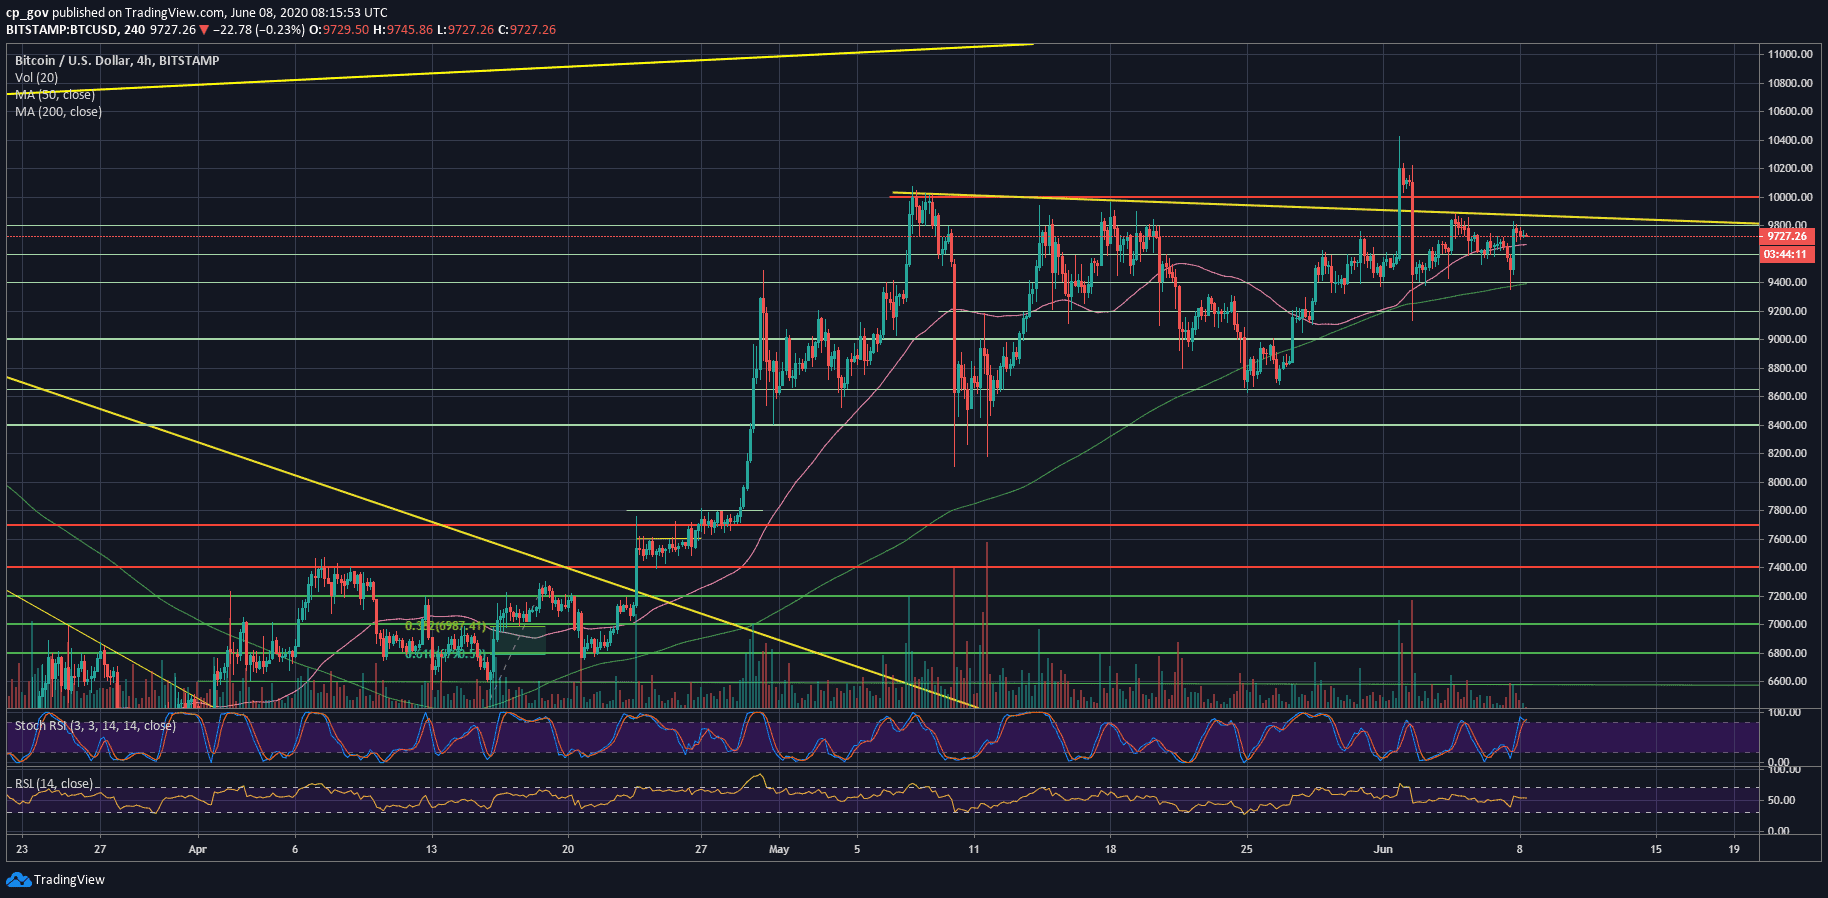
On the micro-level, aside from a price glitch that took place yesterday, Bitcoin is steadily trading between $9600 – $9800 over the past five days.
The first level of resistance now lies at $9800 – $10,000. A breakout, and Bitcoin is likely to retest $10,200 quickly and might even go to $10,500. The latter is the 2020 high, which was reached mid-February and in the middle of the past week.
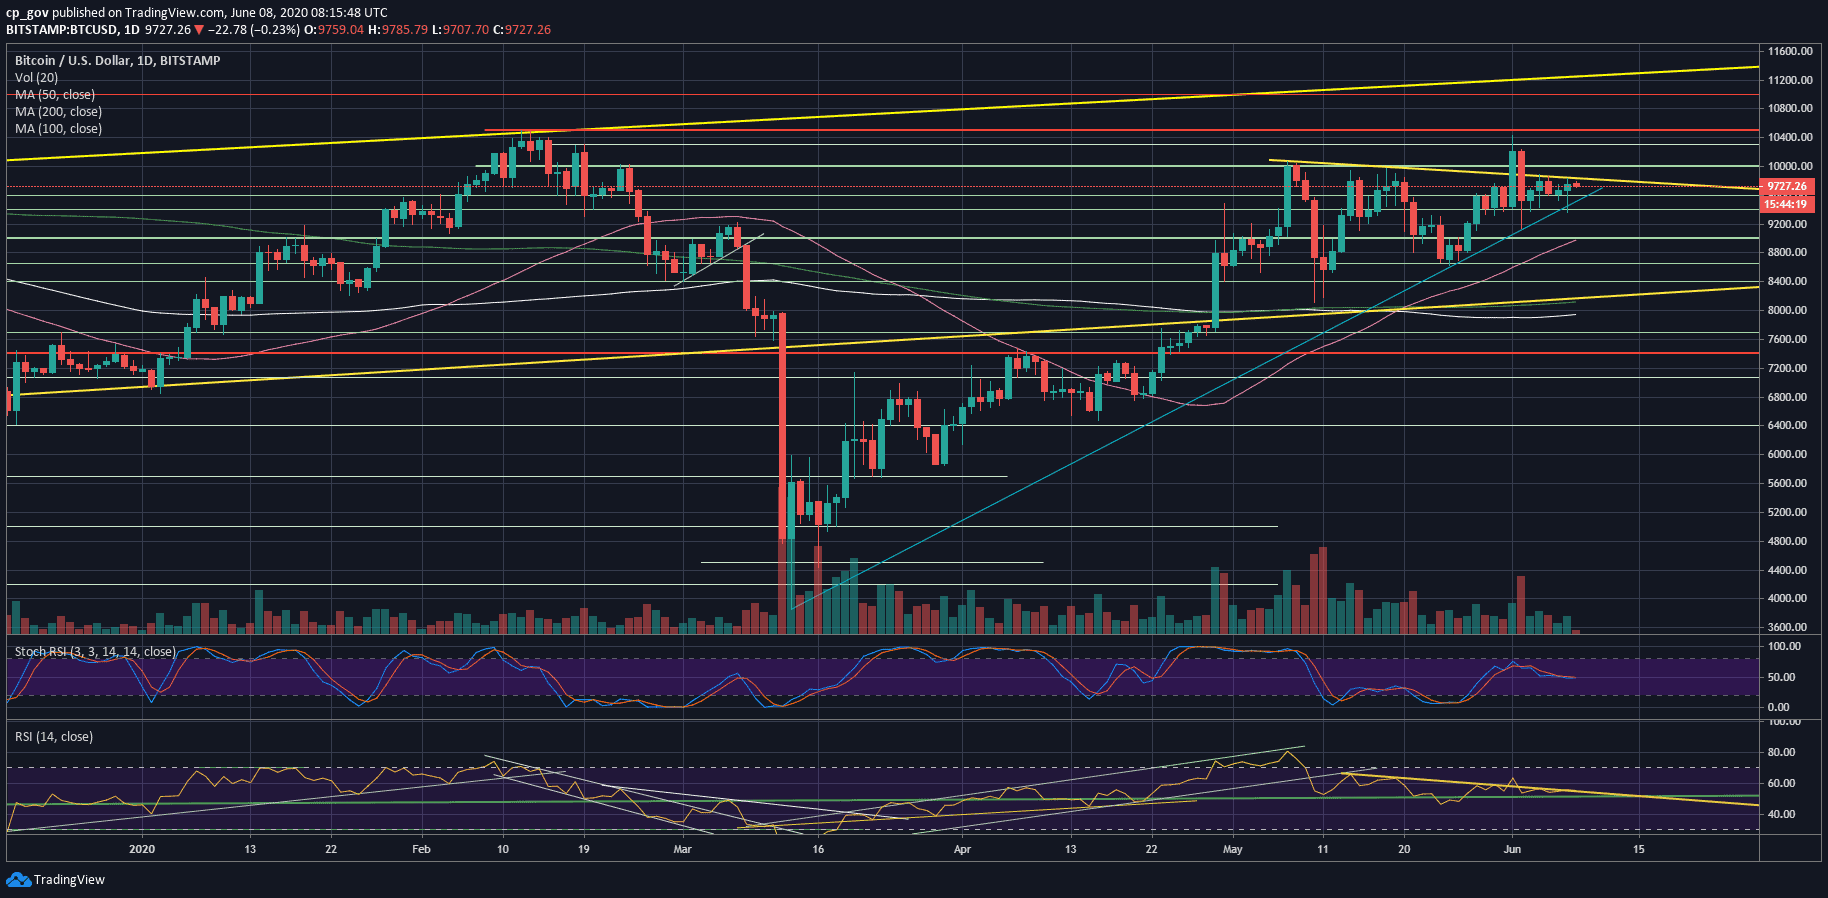
From below, $9400 proved itself as a superior level of support. In case Bitcoin breaks down, then the next significant support lies at $9200 and $9K, which contains the 50-days moving average line (marked pink).
From the technical point of view, the RSI indicator is also ‘stuck’ following descending trend-line, which is serving as resistance.
Upon a breakout in any direction, we will look to see the RSI breaking above 60 or below 50.
The trading volume levels also see the indecisive of the price. The past five days were among the lowest volume days over the past three months.
Total Market Cap: $276.7 billion
Bitcoin Market Cap: $179.2 billion
BTC Dominance Index: 64.8%
*Data by CoinGecko
BTC/USD BitStamp 4-Hour Chart
BTC/USD BitStamp 1-Day Chart
The post Bitcoin’s Crucial Week: Huge Price Move Anticipated As 2017-Weekly Trendline Comes To An End (BTC Analysis) appeared first on CryptoPotato.
The post appeared first on CryptoPotato


