
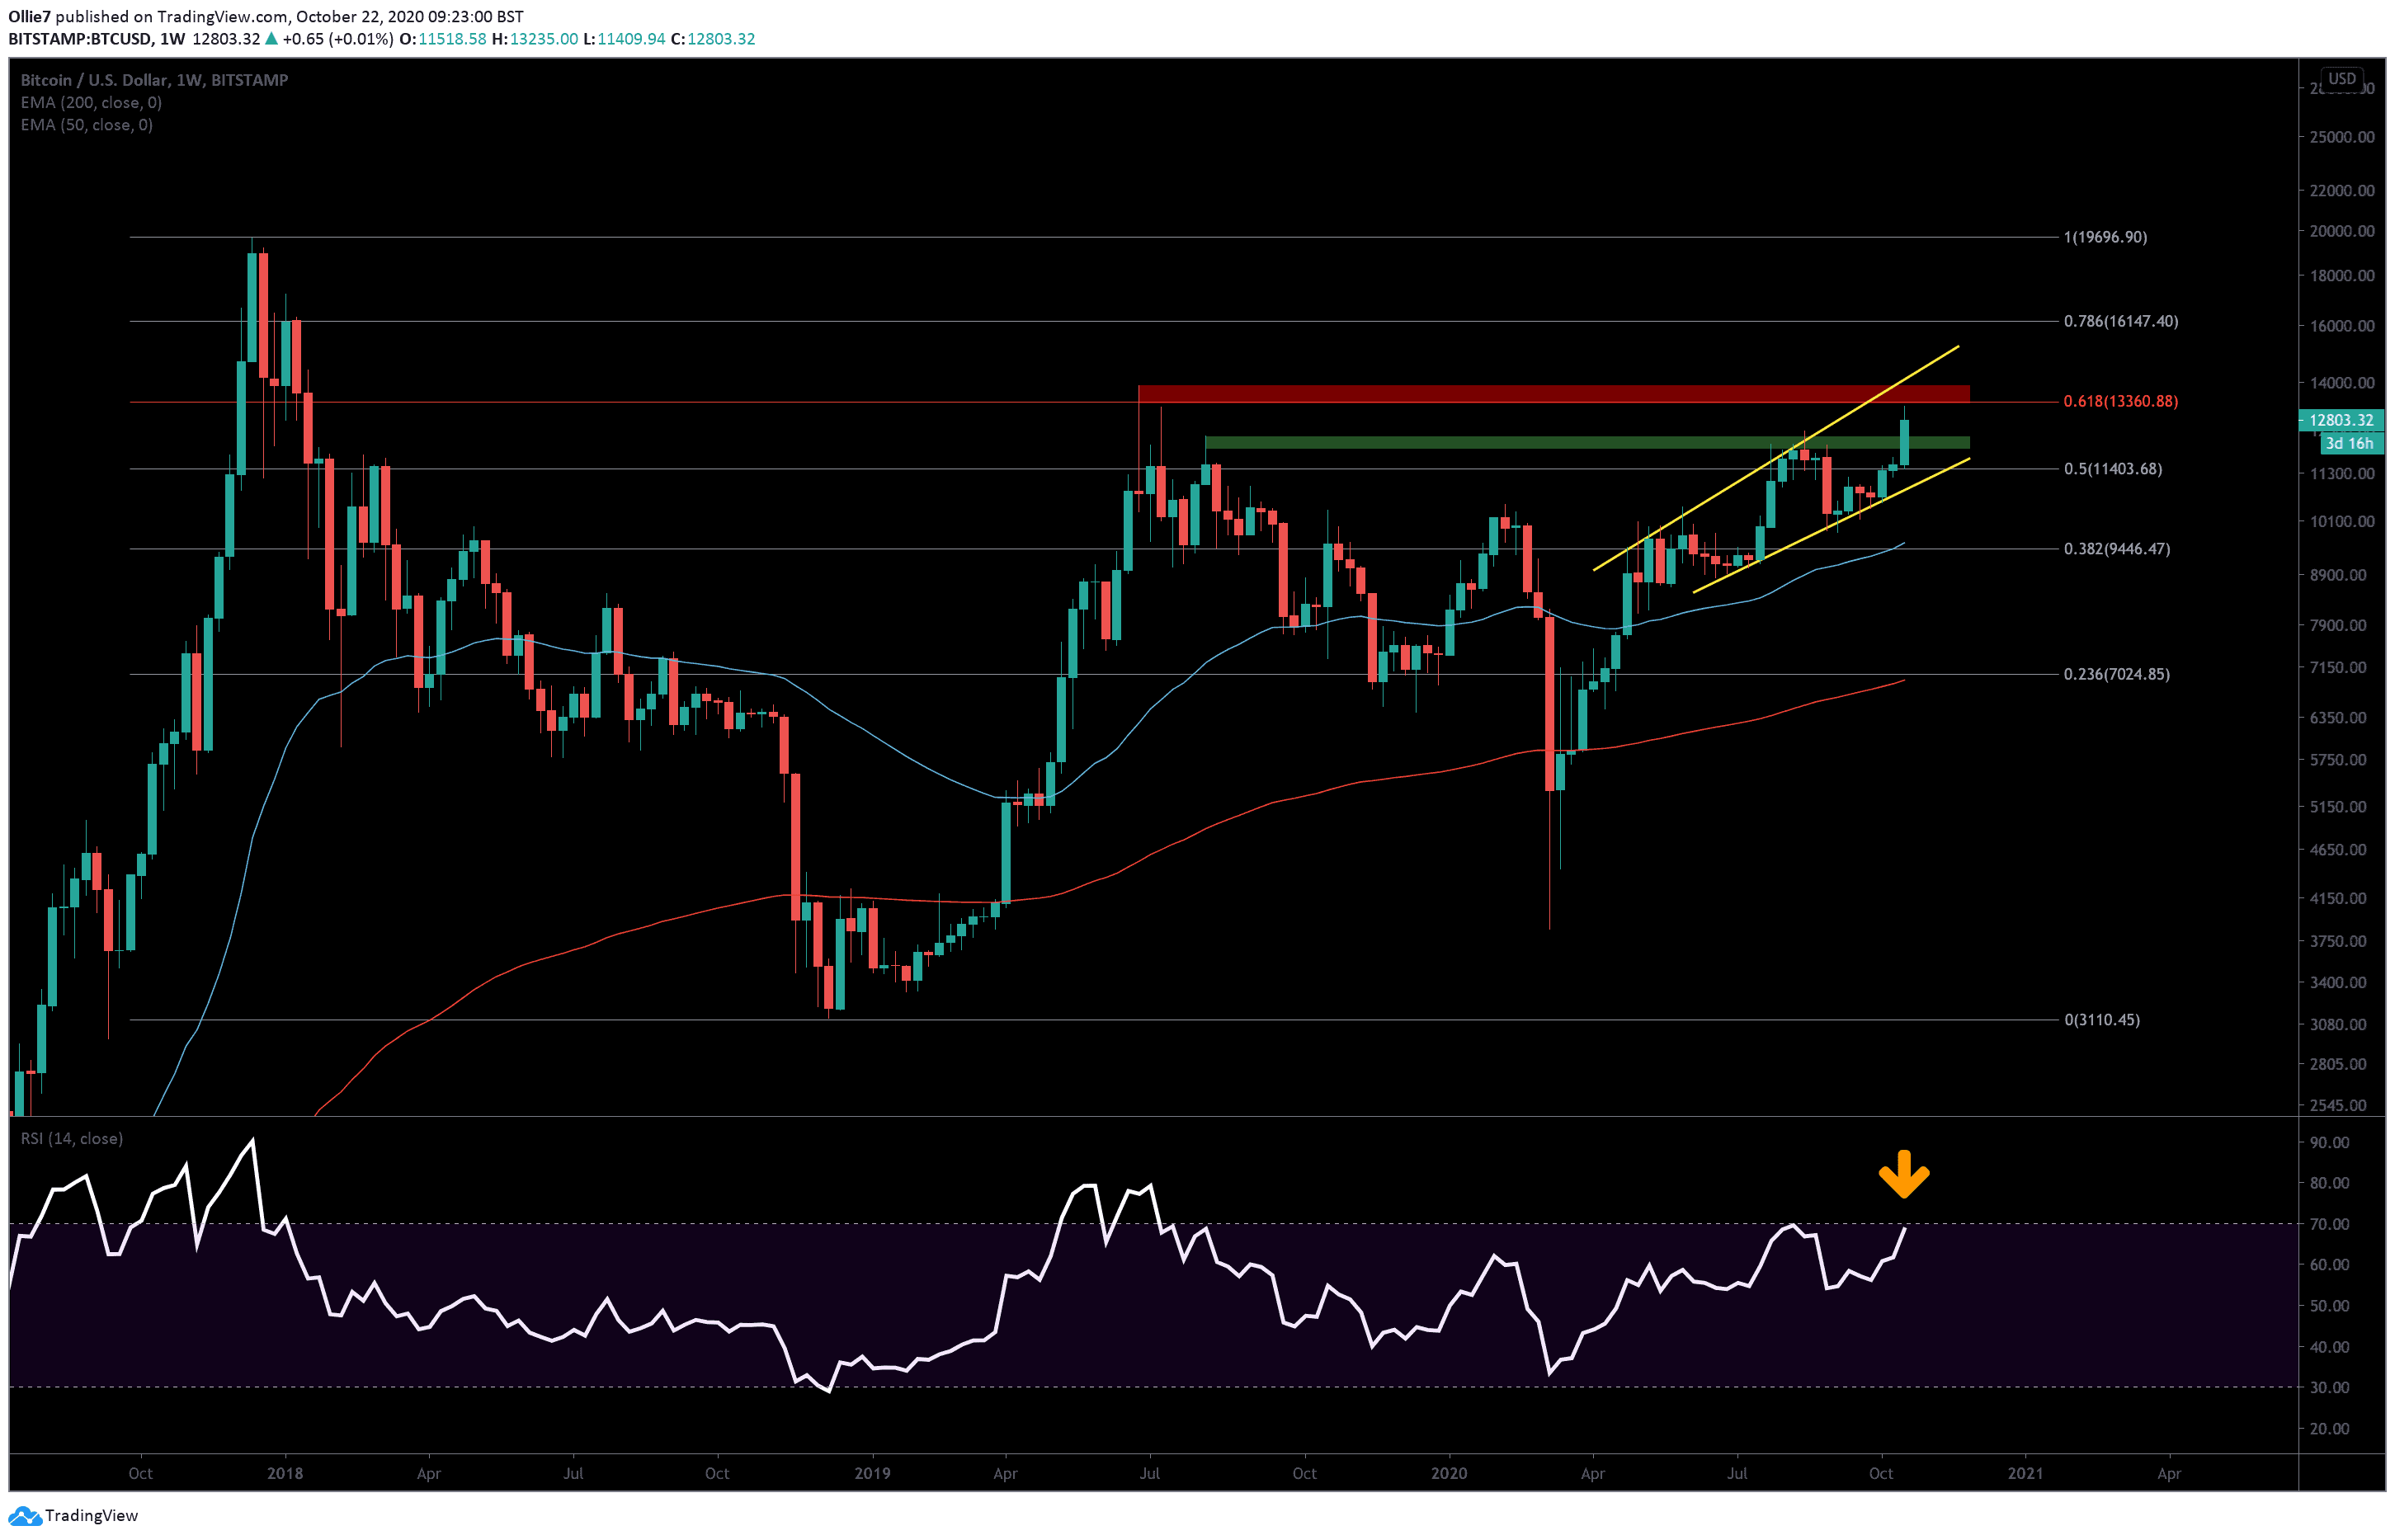
Bitcoin price has managed to avoid all 3 unfilled CME gaps this week and go on to break the $13,235 level for the first time since July 10, 2019 – 469 days ago.
The catalyst for the 11% surge was the breaking news from PayPal yesterday that the payments giant will soon facilitate BTC and other crypto-asset payments.
According to data from Datamish, the Paypal rally caused a $70.8M short squeeze on BitMEX as an eye-popping $31 billion returned to the crypto market during yesterday’s frenzy. This will have undoubtedly helped catapult prices beyond the milestone $12K and $13K levels as short traders buy back into BTC to cover losses.
Price Levels to Watch in the Short-Term
On the weekly BTC/USD chart, we can see that prices fell just shy of the 0.618 Fibonacci resistance at $13,360. Between this price point and the $13,890 level above, we have a major resistance zone (red shaded area) that has not been closed above since January 15, 2018 – during the huge crash from Bitcoin’s all-time high of $20,000.
This will be a massive psychological barrier for bullish traders to overcome, and will need considerable momentum to break it successfully.
Just above this area, we also have the upper resistance line of a broadening wedge pattern that bitcoin price has been tracking inside of since April 27, 2020, on the weekly chart (yellow lines). This currently sits around the $14,000 level. It’s possible that we could see a reaction at this trend line if prices managed to break through the aforementioned red zone.
From there, the most obvious daily resistances above this are the $14,600, $15,400, and $15,800 levels, before we get to the 0.786 Fibonacci level at $16,150.
Looking at potential supports, we have a key S/R zone (green shaded area) between $11,950 and $12,300, which should create some buying pressure to push back against a bearish decline.
Underneath that, we have the 0.5 Fibonacci level at $11,400, the daily 50 EMA (blue) at approx $11,170, and the support line of the broadening wedge pattern at around the $10,900 area.
With Bitcoin now dangerously close to breaking into the overbought region on the weekly RSI for the first time since July 2019, it’s possible that we could see a sharp decline as trading bots are triggered by the indicator before a new leg of the uptrend begins.
Total market capital: $395 billion
Bitcoin market capital: $ 237 billion
Bitcoin dominance: 60.1%
*Data by Coingecko.
Bitstamp BTC/USD Weekly Chart
Binance Futures 50 USDT FREE Voucher: Use this link to register & get 10% off fees and 50 USDT when trading 500 USDT (limited offer).
Disclaimer: Information found on CryptoPotato is those of writers quoted. It does not represent the opinions of CryptoPotato on whether to buy, sell, or hold any investments. You are advised to conduct your own research before making any investment decisions. Use provided information at your own risk. See Disclaimer for more information.
The post appeared first on CryptoPotato


