
Ethereum is slowly moving down and it recently broke the $125 support against the US Dollar.The price is now facing a couple of key hurdles near the $126 and $128 levels.Yesterday’s key bearish trend line is active with resistance near $127 on the hourly chart of ETH/USD (data feed via Kraken).Bitcoin is currently consolidating near the $7,200 support area, with a minor bearish angle.Ethereum price is slowly moving into a bearish zone versus the US Dollar and bitcoin. ETH price remains at a risk of more losses as long as it is below $130.Ethereum Price AnalysisAfter struggling to stay above the $130 support, Ethereum price extended its decline against the US Dollar. ETH price broke the $128 and $126 support levels to move into a short term bearish zone.Moreover, the price broke the $125 support and the 100 hourly simple moving average. It traded to a new intraday low near $123 and it is currently correcting higher.There was a break above the 23.6% Fib retracement level of the recent slide from the $130 high to $123 low. However, the price is facing a couple of key hurdles near the $126 and $128 levels.Besides, the 50% Fib retracement level of the recent slide from the $130 high to $123 low is near the $126 level. More importantly, yesterday’s key bearish trend line is active with resistance near $127 on the hourly chart of ETH/USD.The trend line is also close to the 100 hourly SMA near $127. Therefore, a successful close above the $126 and $128 levels is needed for a decent recovery. Additionally, the price could start a strong rise if it clears the $130 resistance area.On the other hand, the price might fail to recover above the $128 and $130 resistance levels. In the mentioned case, there is a risk of more losses below the $123 low.An initial support is near the $122 level, below which there are chances of more downsides below the $120 support area. The next major buy zone is seen near the $116 and $115 levels.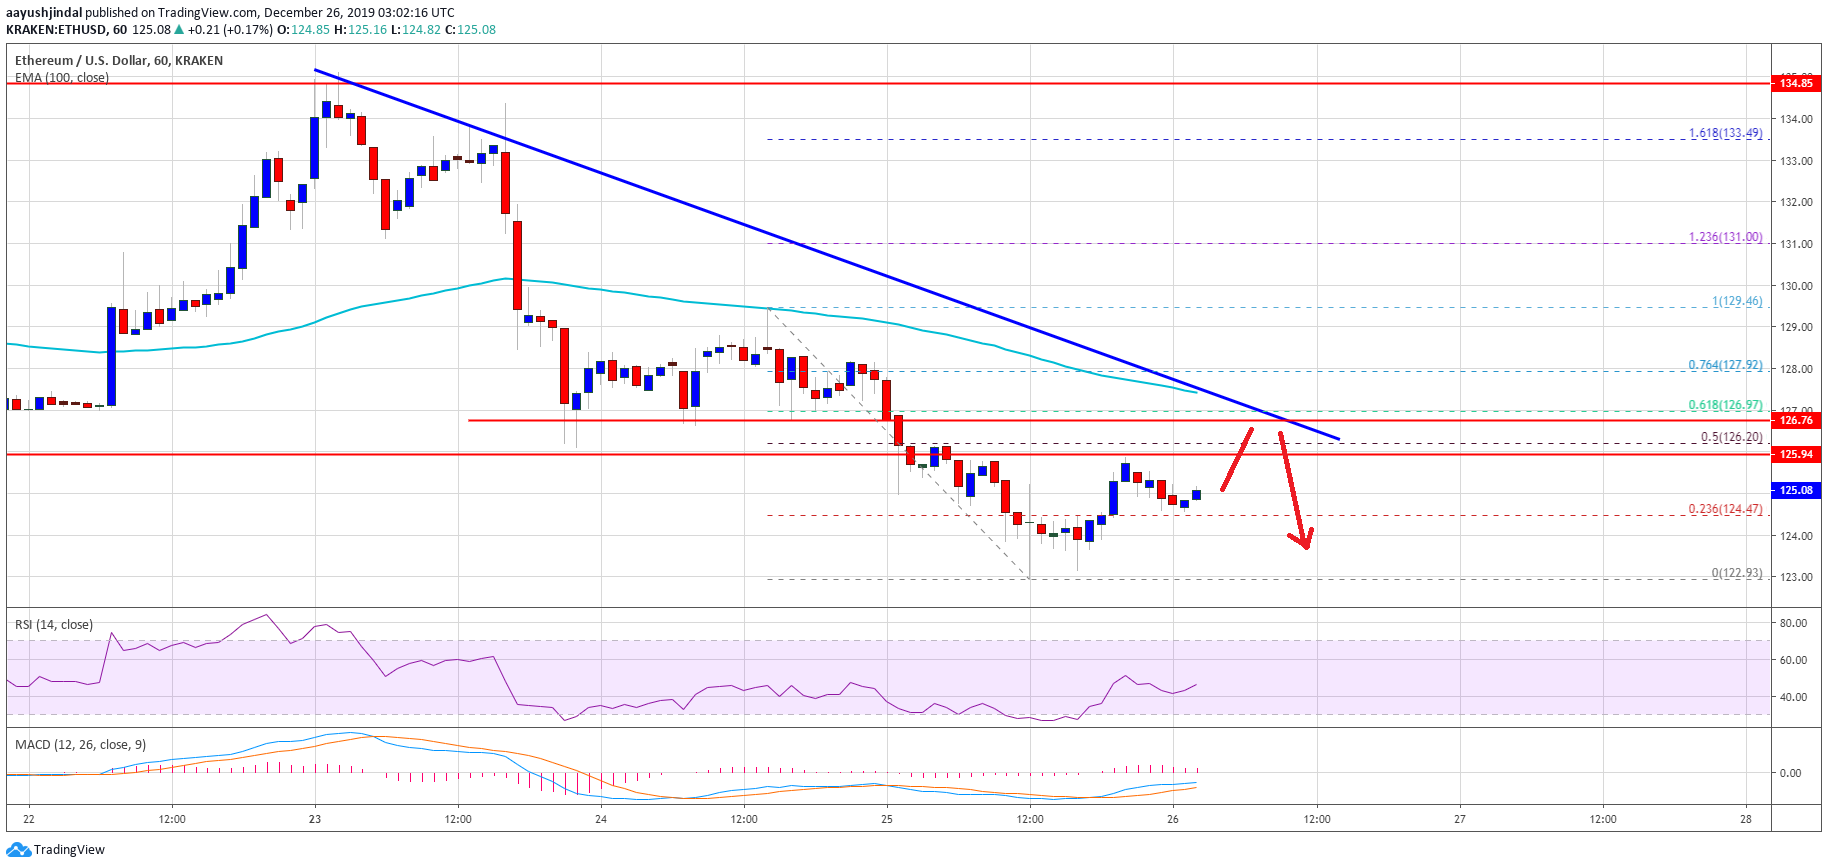 Ethereum PriceLooking at the chart, Ethereum price is slowly turning bearish below the $128 and $130 levels. As long as there is no close above the $130 level, there is a risk of a downside extension below the $120 support. If not, it could rally towards $135 and $140.ETH Technical IndicatorsHourly MACD – The MACD for ETH/USD is slowly moving in the bullish zone.Hourly RSI – The RSI for ETH/USD is now above the 40 level, with a few positive signs.Major Support Level – $122Major Resistance Level – $128The post appeared first on NewsBTC


