
Chainlink‘s bulls have been successful in pushing the crypto-asset past the important level at $10.5, and more gains could be in store for LINK. Further down the crypto-ladder, Augur was another coin backed by strong buyer interest while FTT Token broke to the upside of the longer-term trendline resistance.
Chainlink [LINK]
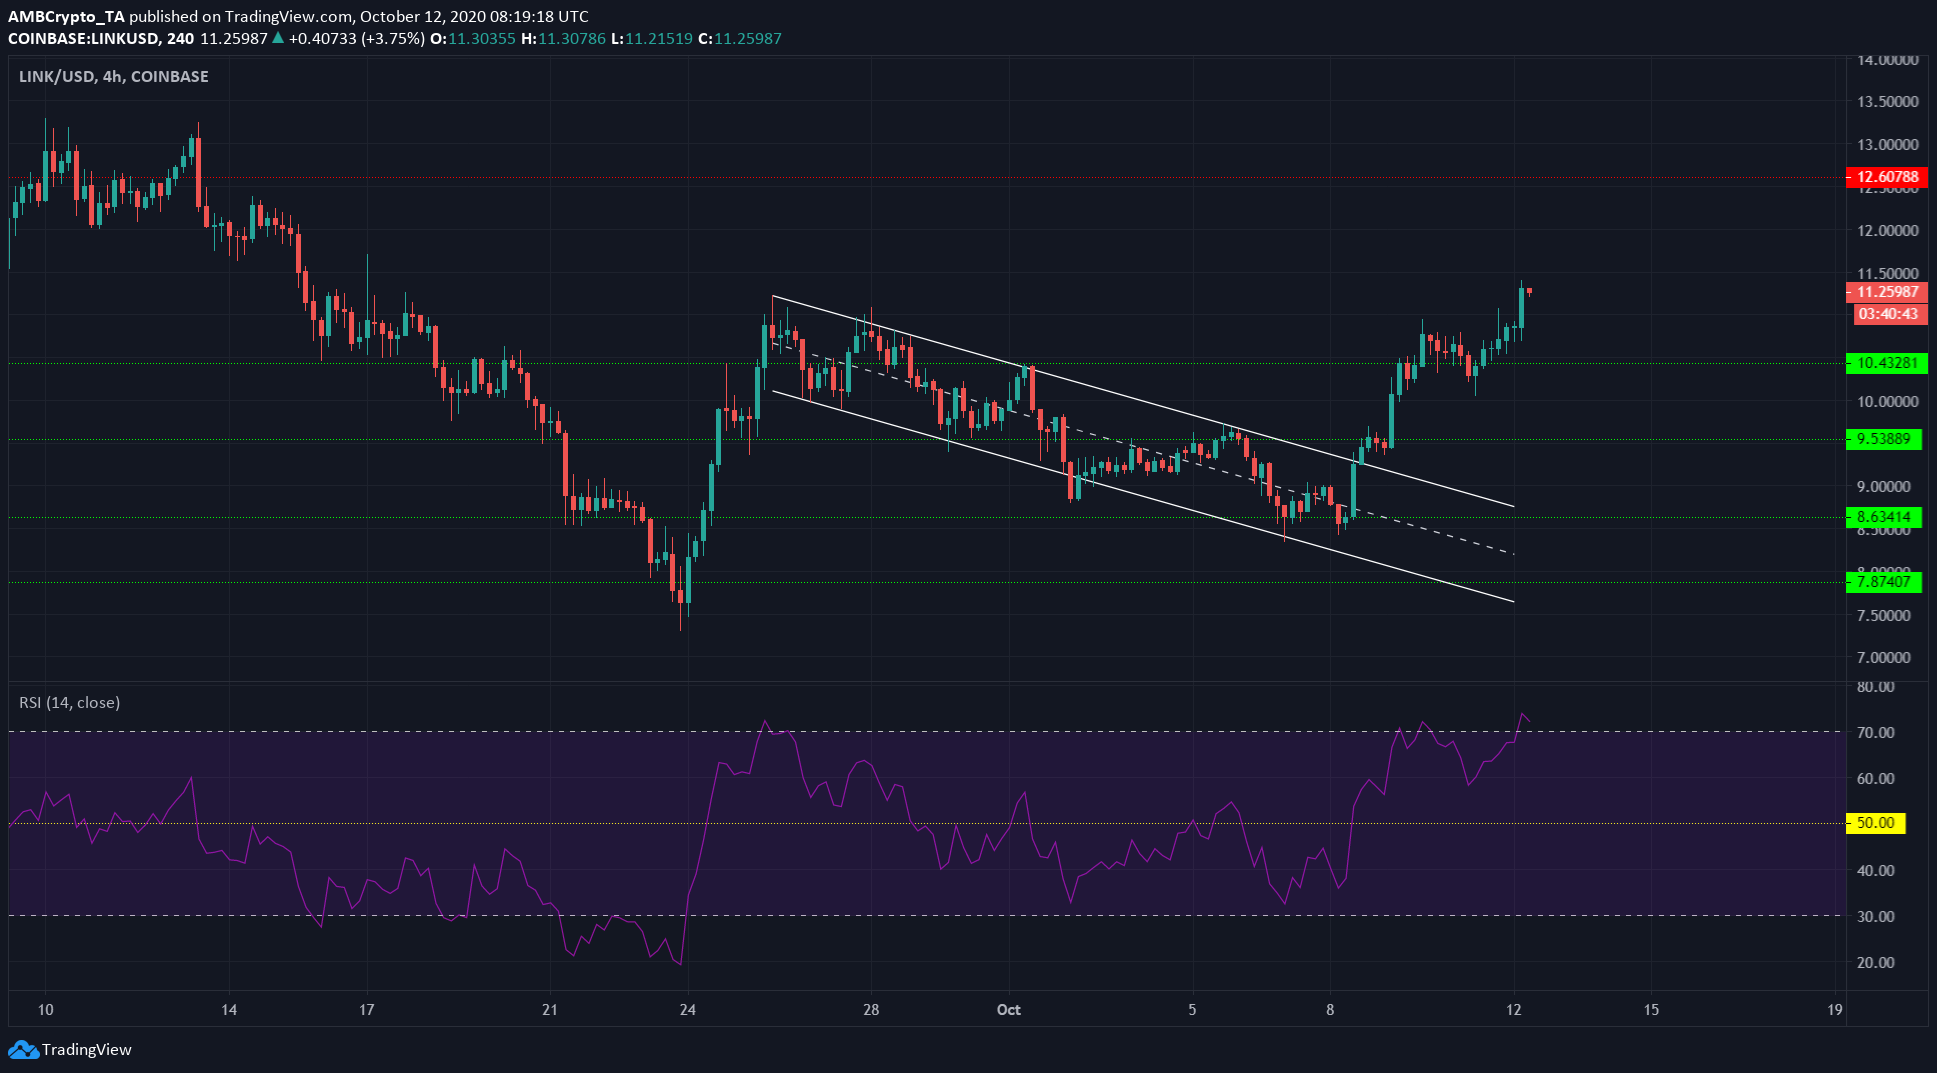
Source: LINK/USD on TradingView
Chainlink broke out of a descending channel and surged past its resistance at $10.5. This was an especially pivotal level because, beyond it, the path of least resistance was towards $12.
Further, the RSI showed that the crypto-asset was in the overbought zone on the 4-hour timeframe, at press time. This illuminated that the asset could see a minor pullback, perhaps to $10.9-$11, before another wave upwards.
In other news, Binance Smart Chain Panama service recently announced its support for Chainlink.
Augur [REP]
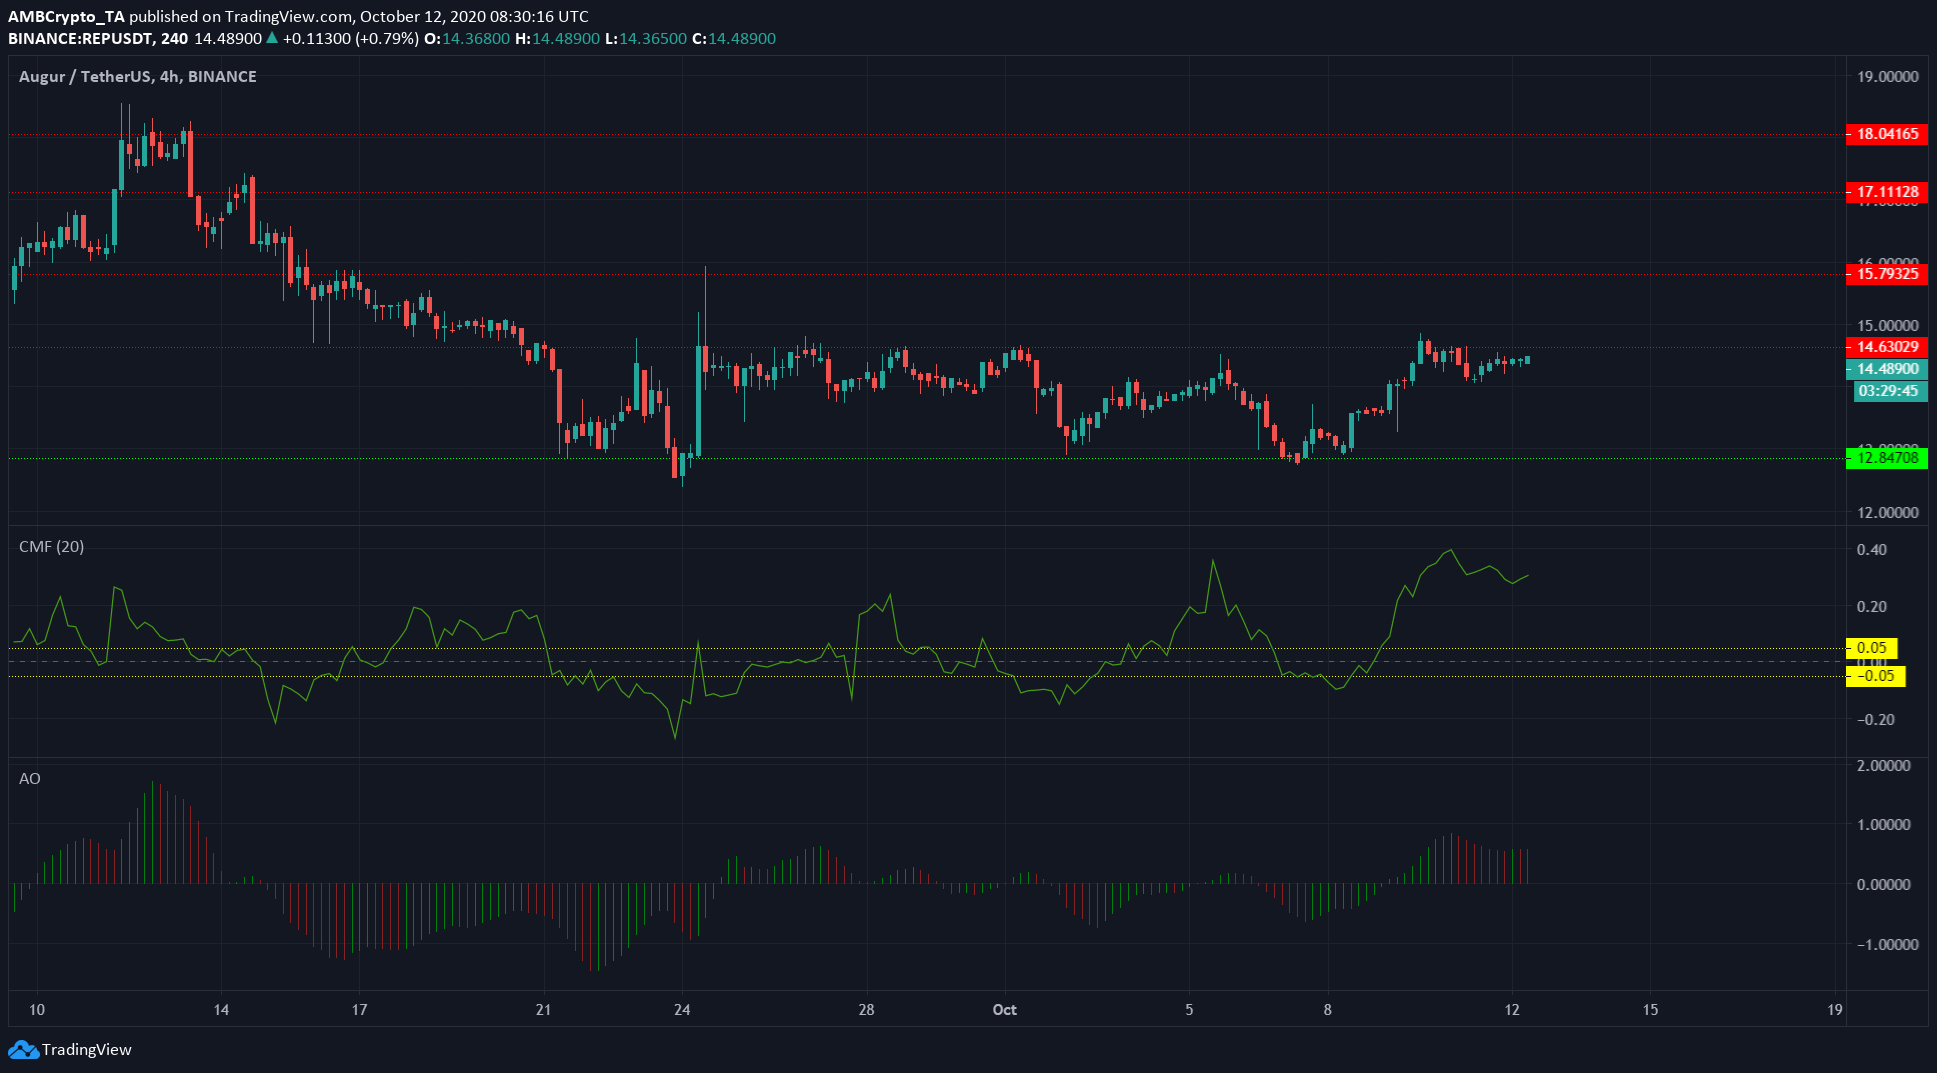
Source: REP/USDT on TradingView
Augur was trading right beneath its resistance level at $14.6. Further, the Chaikin Money Flow pointed to strong capital inflows into the market. This suggested that REP had buyer interest behind it to break past its level of resistance.
The Awesome Oscillator also highlighted a prevalent strong bullish momentum, although it had waned slightly, as indicated by the red bars. And yet, there remained the possibility of the formation of bearish twin peaks which could precipitate a drop for REP.
FTX Token [FTT]
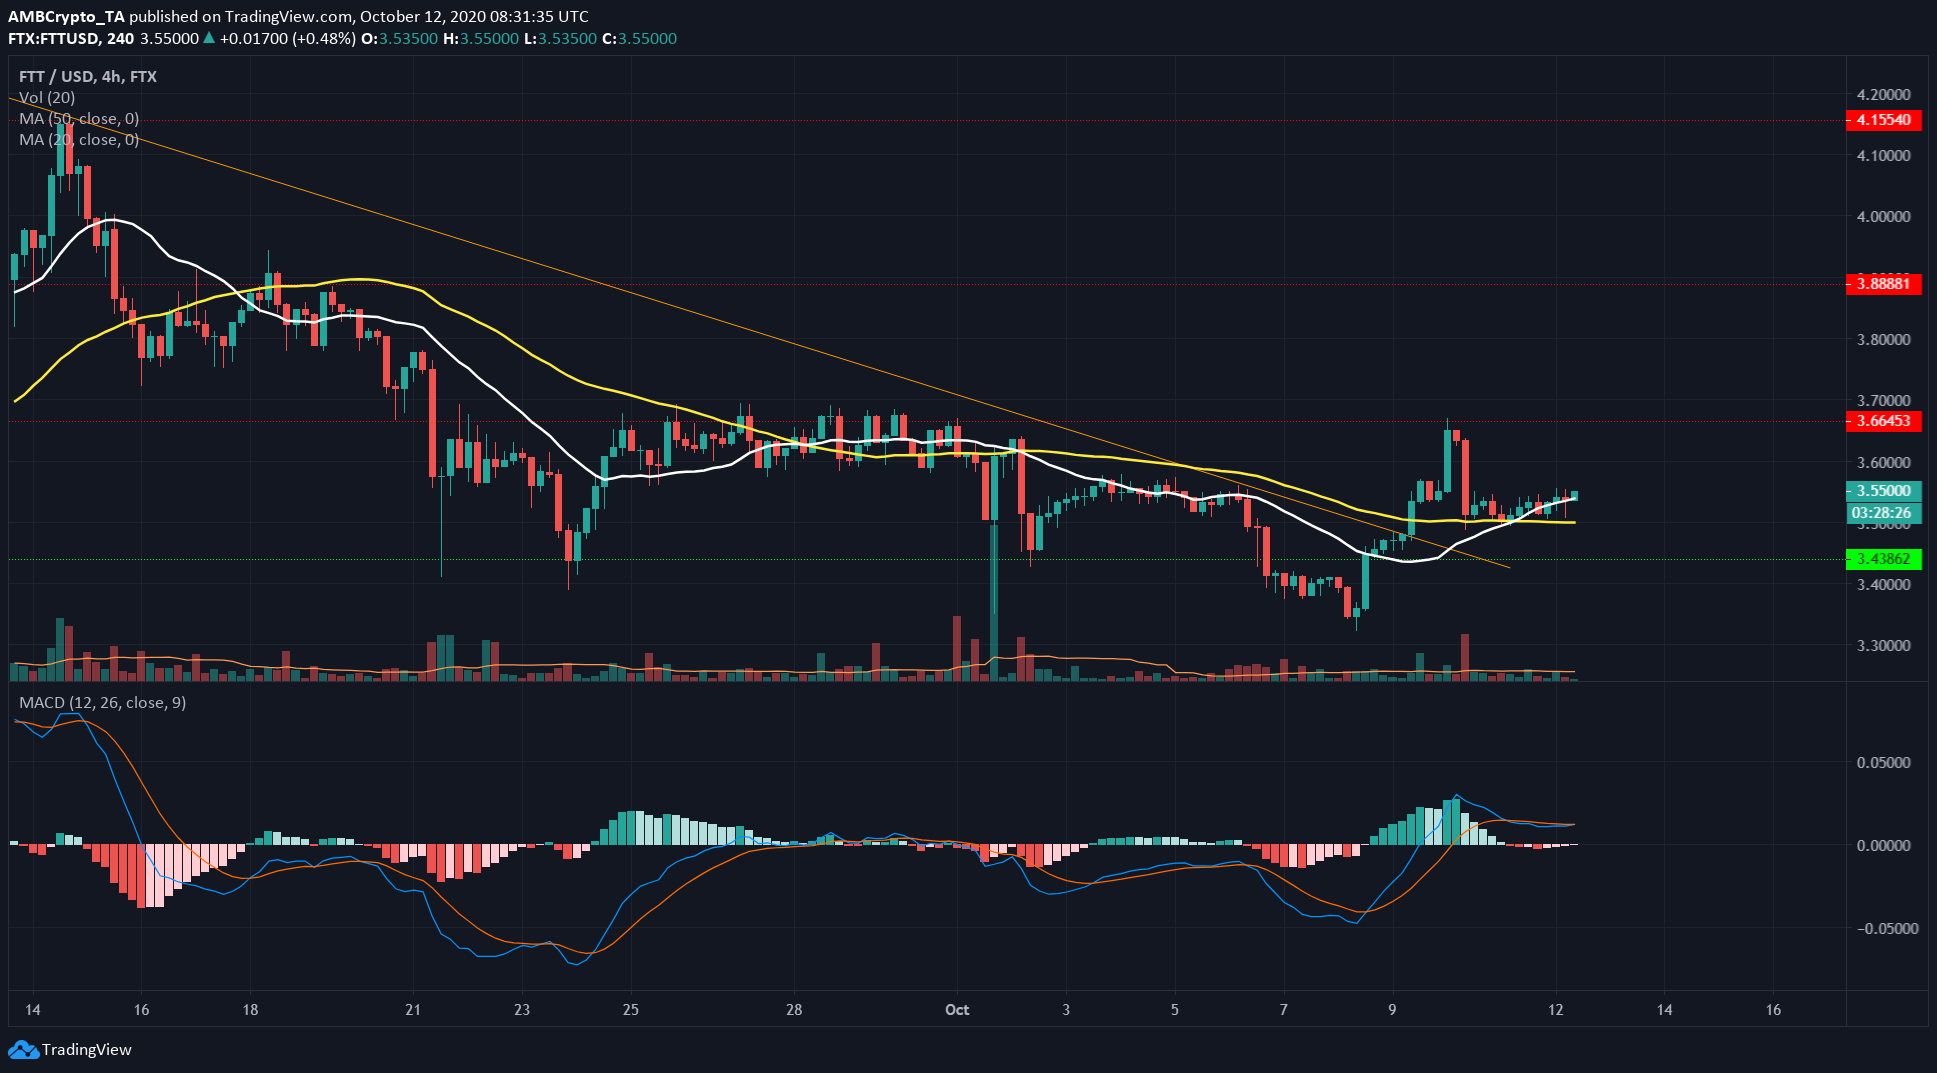
Source: FTT/USD on TradingView
FTT Token found support at the 50 SMA (yellow) recently. The outlook had been bearish for the crypto-asset just a few days ago, but a move above the orange down trendline and the formation of a higher low suggested a possible shift in trend for FTT.
The MACD formed a bullish crossover and moved upwards of zero over the last few days as well, reinforcing the bullish scenario. At press time, the MACD line had snaked just beneath the signal line, while still above zero – a weak sell signal.
It was possible for FTT to test the $3.66 resistance in the coming days if the moving averages hold as support.
Recently, news broke that the Cream Finance community had decided to call a vote to delist FTT after allegations that FTX’s Sam Bankman-Fried used the FTT token to fund short-selling of YFI.
The post appeared first on AMBCrypto


