
Bitcoin was in a period of relatively low volatility over the past 90 days. Chainlink was overwhelmed by sellers in the long-term, while LINK bulls sought to defend a level of support. Cosmos retested a level of support-turned-resistance and was likely headed lower and DigiByte could have some gas in the tank to post minor gains before another wave of selling pressure.
Chainlink [LINK]
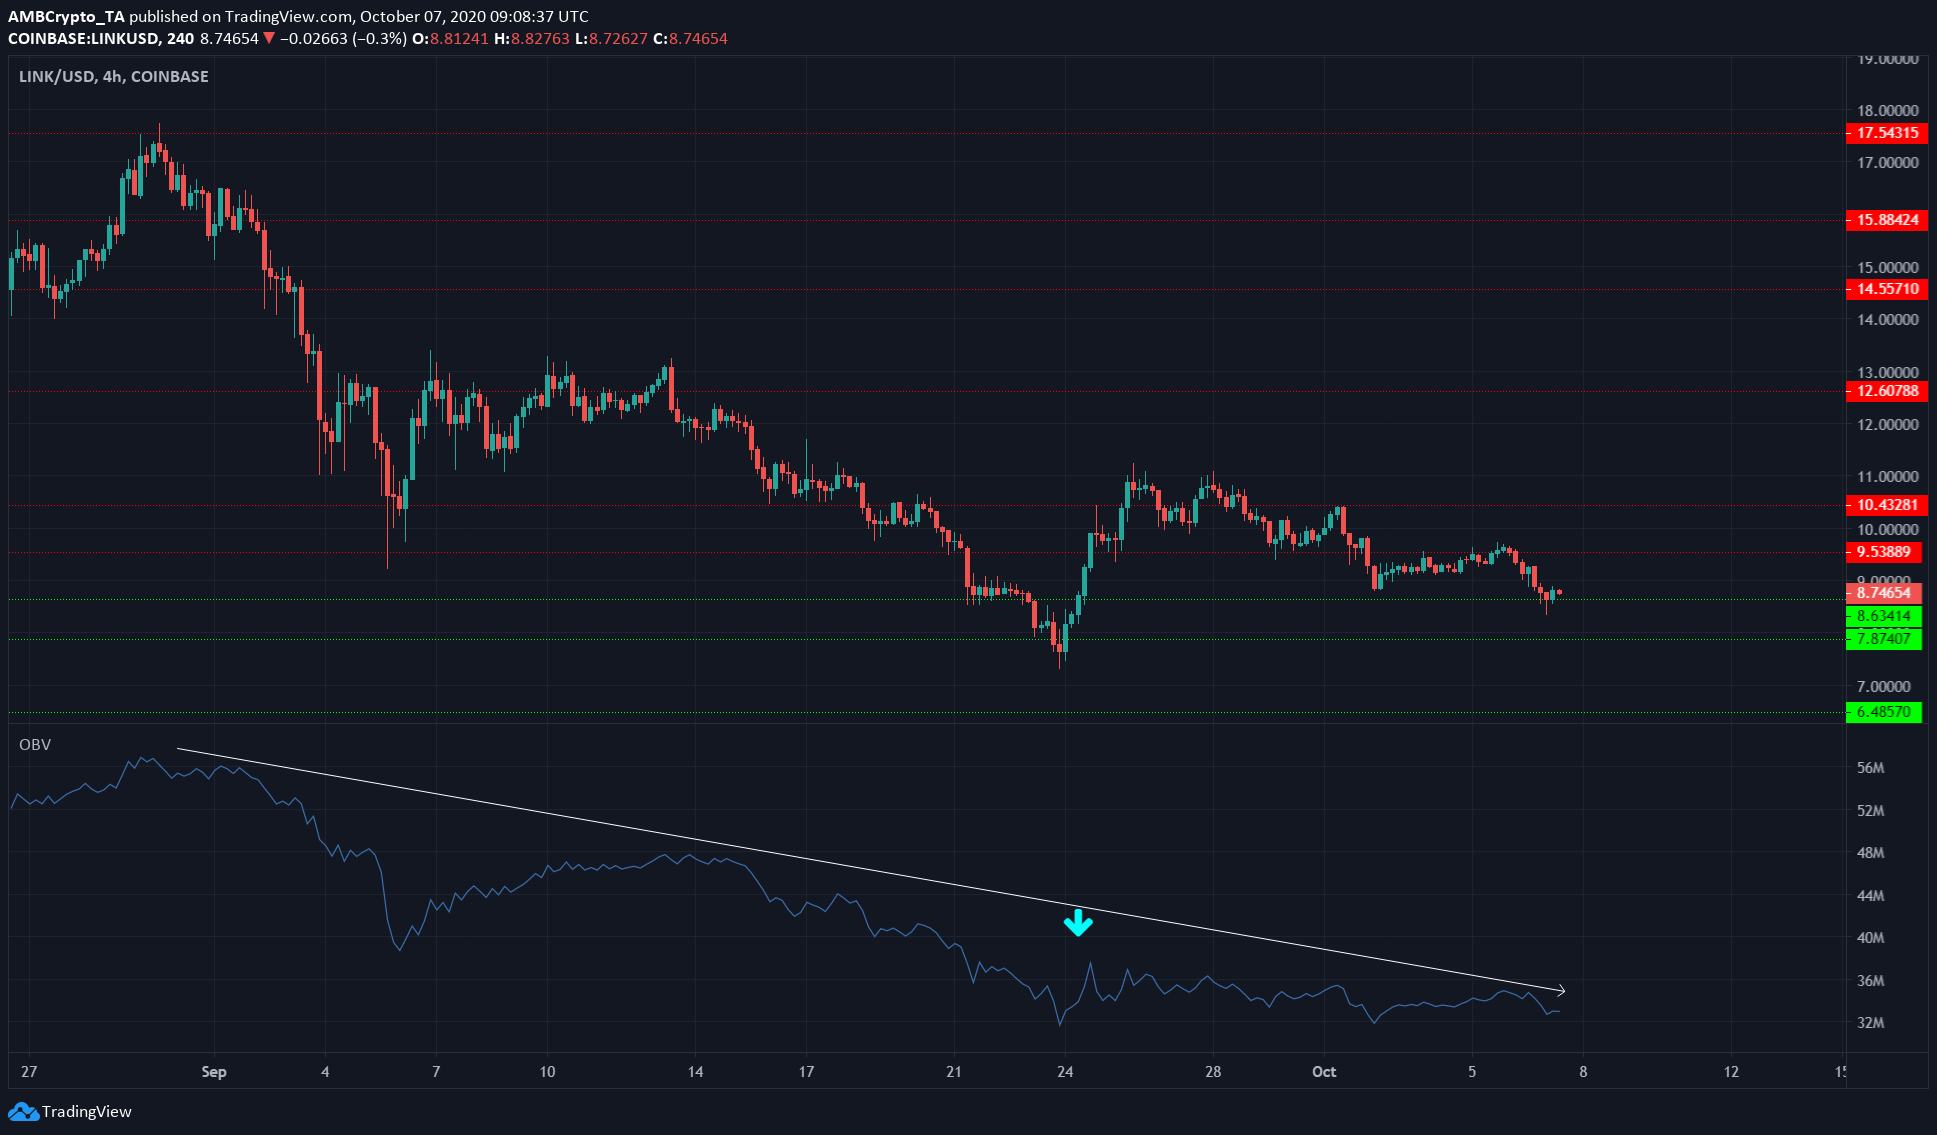
Source: LINK/USD on TradingView
Chainlink fell from $9.5 to $8.6 in the past 24 hours. A couple of weeks ago, LINK bounced sharply off support at the $7.8 level, to reach $11.2. Yet, this was not a reversal in trend but a relief bounce.
Highlighted by the cyan arrow on the OBV, the aforementioned surge of around 43% occurred with quite unremarkable buying volume, compared to the selling volume that had been present since August.
The OBV has been unable to rise past even that tiny blip on the charts. As shown by the white trendline, the OBV has also been steadily trending downward, showing overwhelming selling volume.
Without buyer interest, LINK was quite likely to slide further.
Cosmos [ATOM]
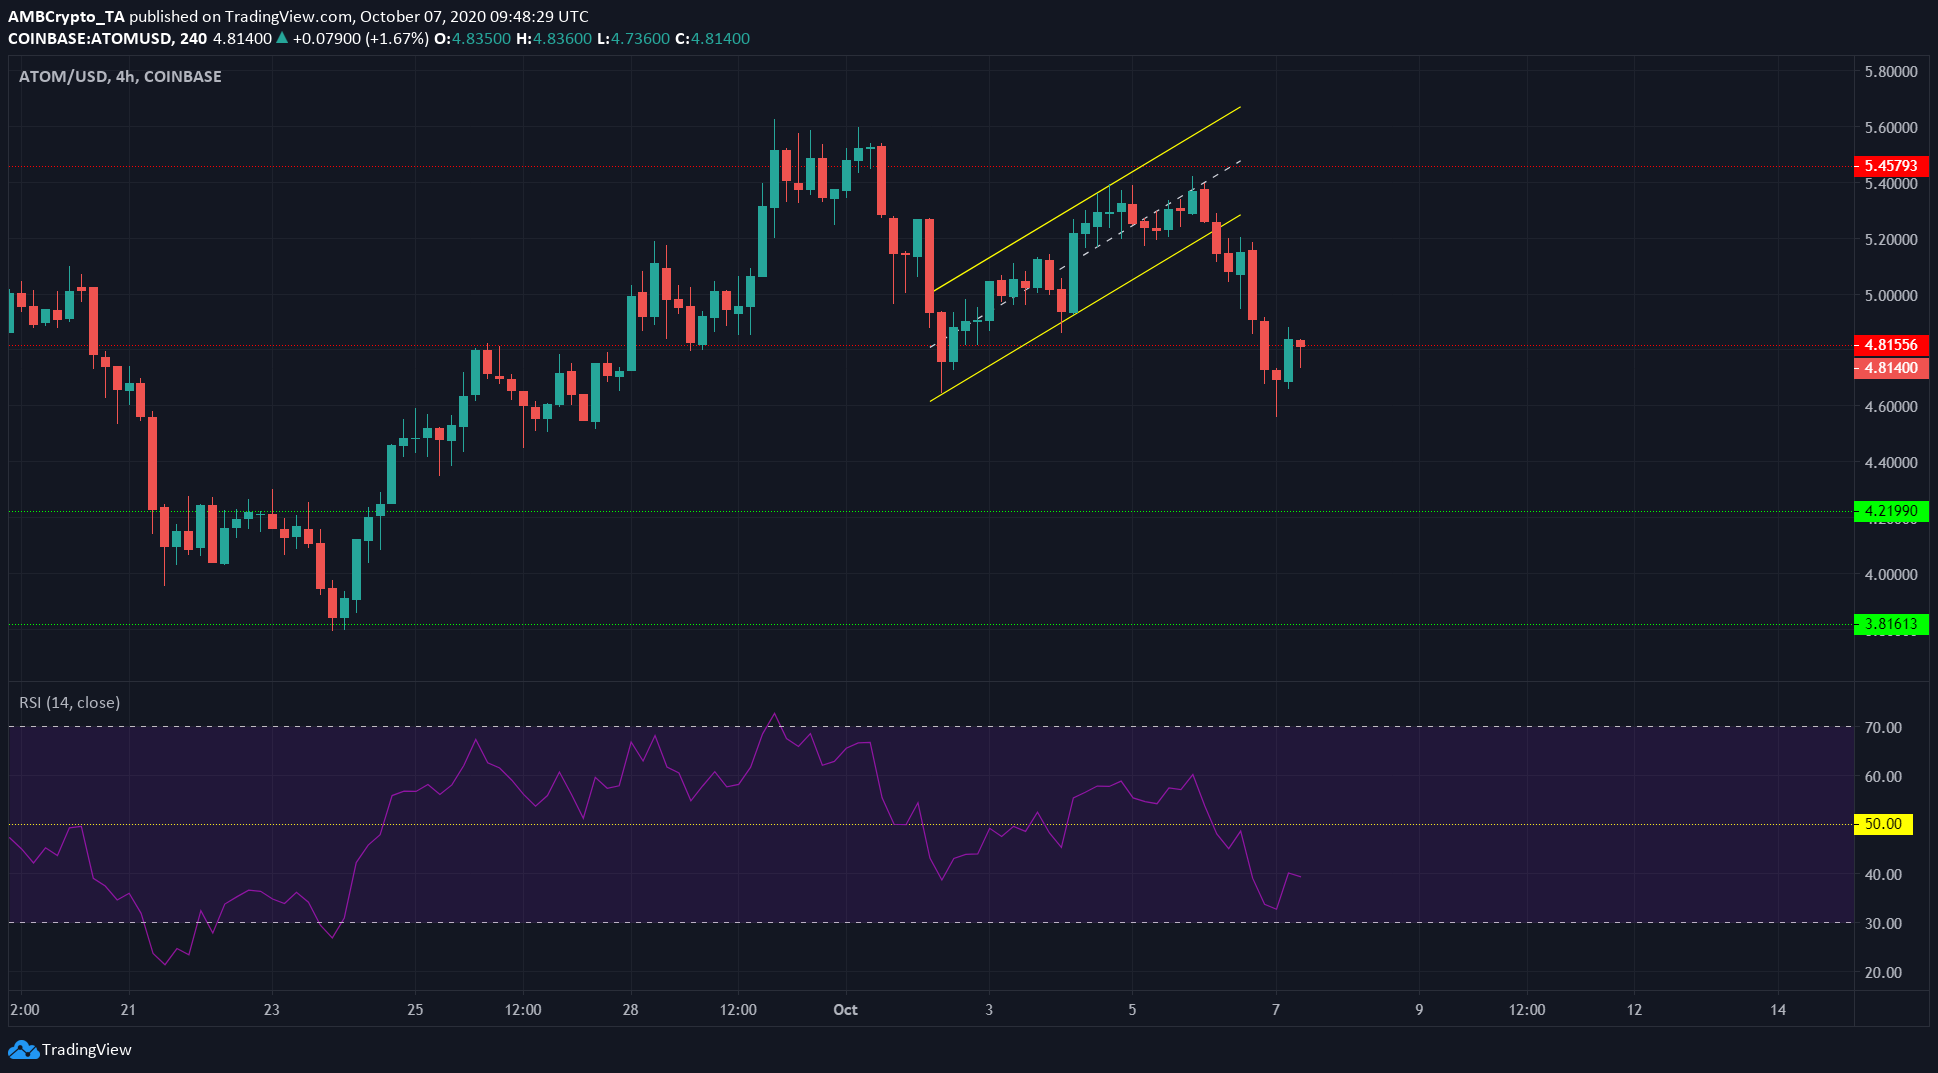
Source: ATOM/USD on TradingView
ATOM closed beneath an ascending channel and proceeded to register rapid losses. At the time of writing, it had lost a level of support and retested the same level, at $4.81, as resistance and looked likely to head lower.
The RSI also showed bearish momentum for the asset. It had a value of 39. The RSI has trended lower since ATOM registered a high at $5.45 and this was likely to continue.
DigiByte [DGB]
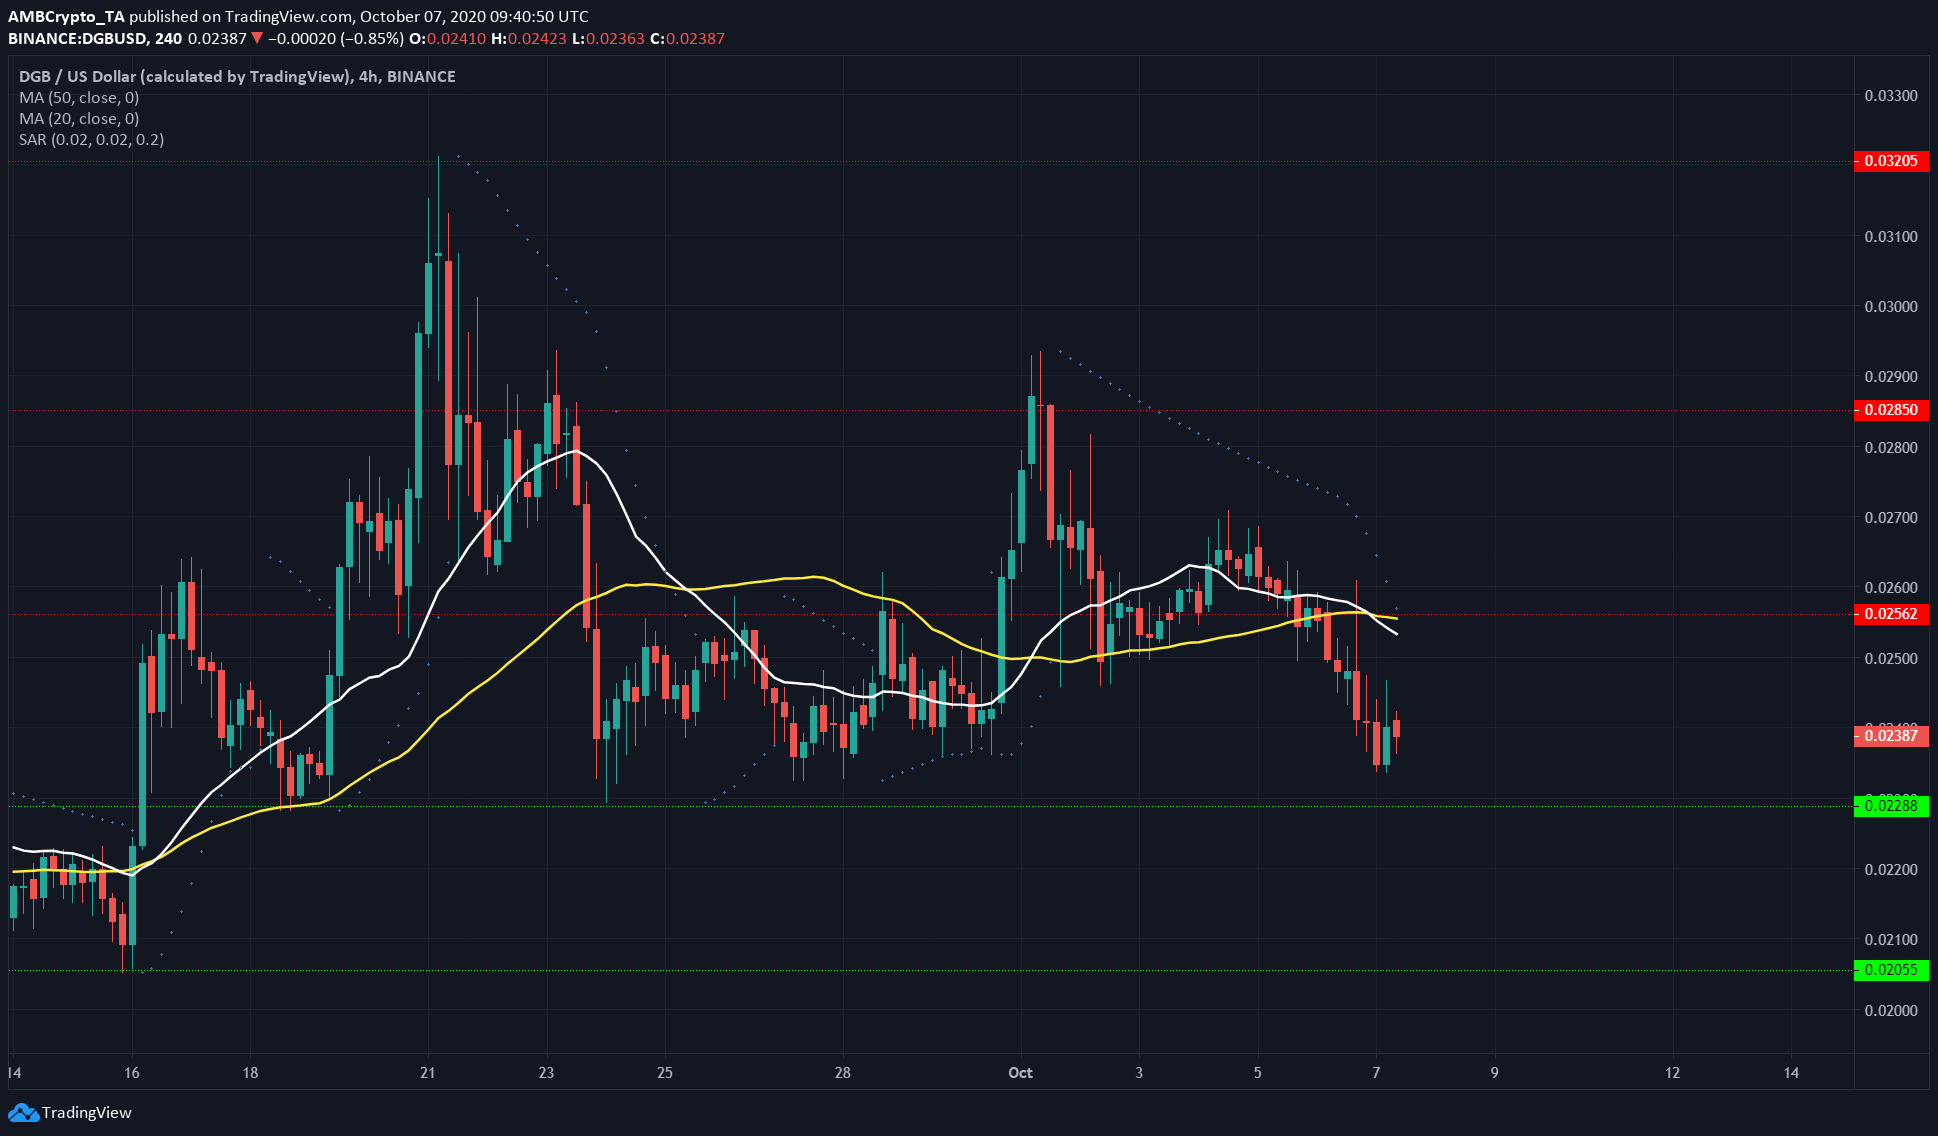
Source: DGB/USD on TradingView
DGB has set lower highs since surging to $0.32 in September. Since then, it has been rejected at the $0.28 resistance and failed to hold on to $0.256 as support.
20 SMA (white) crossed beneath 50 SMA (yellow) indicating bearishness in the past few days. Parabolic SAR also gave a sell signal and showed the asset had plunged beneath support with momentum.
The region at $0.255 would offer strong resistance to DGB if a retest occurred in the next few trading sessions.
It was likely that DGB would rise to $0.2475 before another drop.
The post appeared first on AMBCrypto


