Chainlink was recording strong gains on the charts amidst speculation that its rally could be stronger than Bitcoin’s once again, like it was in July. Bitcoin had climbed to $13,300 at press time and it might just head higher, with many other altcoins posting gains too. However, while Waves noted a bearish divergence, Dogecoin continued to trade within a downtrend.
Chainlink [LINK]


Source: LINK/USD on TradingView
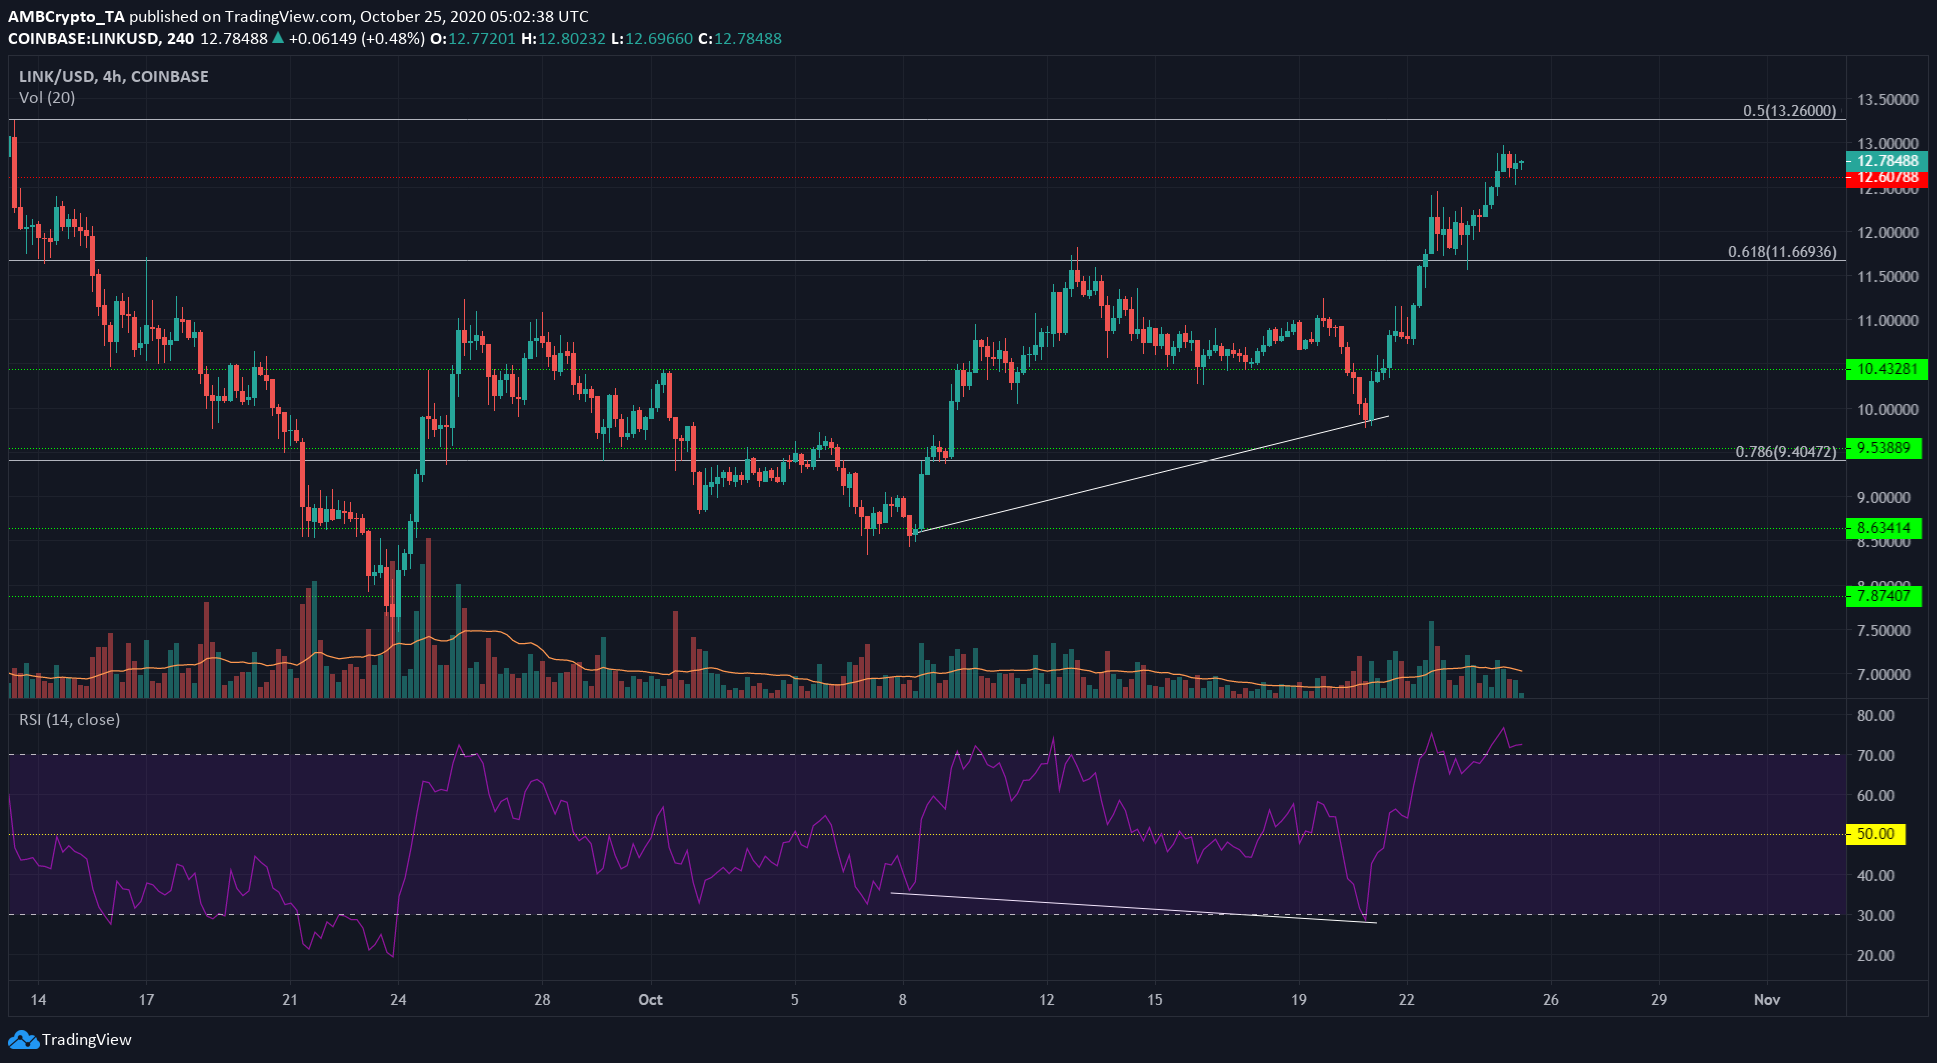
Highlighted on the charts was a bullish divergence (white) between the price and the momentum a couple of days ago. This saw the crypto-asset surge past $10.4 and $11, with the 61.8% retracement level at $11.6 retested before another move upwards.
The Fibonacci Retracement tool was used to identify levels of importance based on July’s move from $6.5 to $20. LINK registered a level of resistance at $12.6, a level that it later flipped to support.
Based on previous levels that LINK traded intensely at, the expectation is that LINK would face minimal resistance until the next region of supply at $14.2 to $14.5, with a level of resistance at $14.55.
Hence, in the coming days, LINK can target $14.5 on the charts.
Waves [WAVES]


Source: WAVES/USDT on TradingView
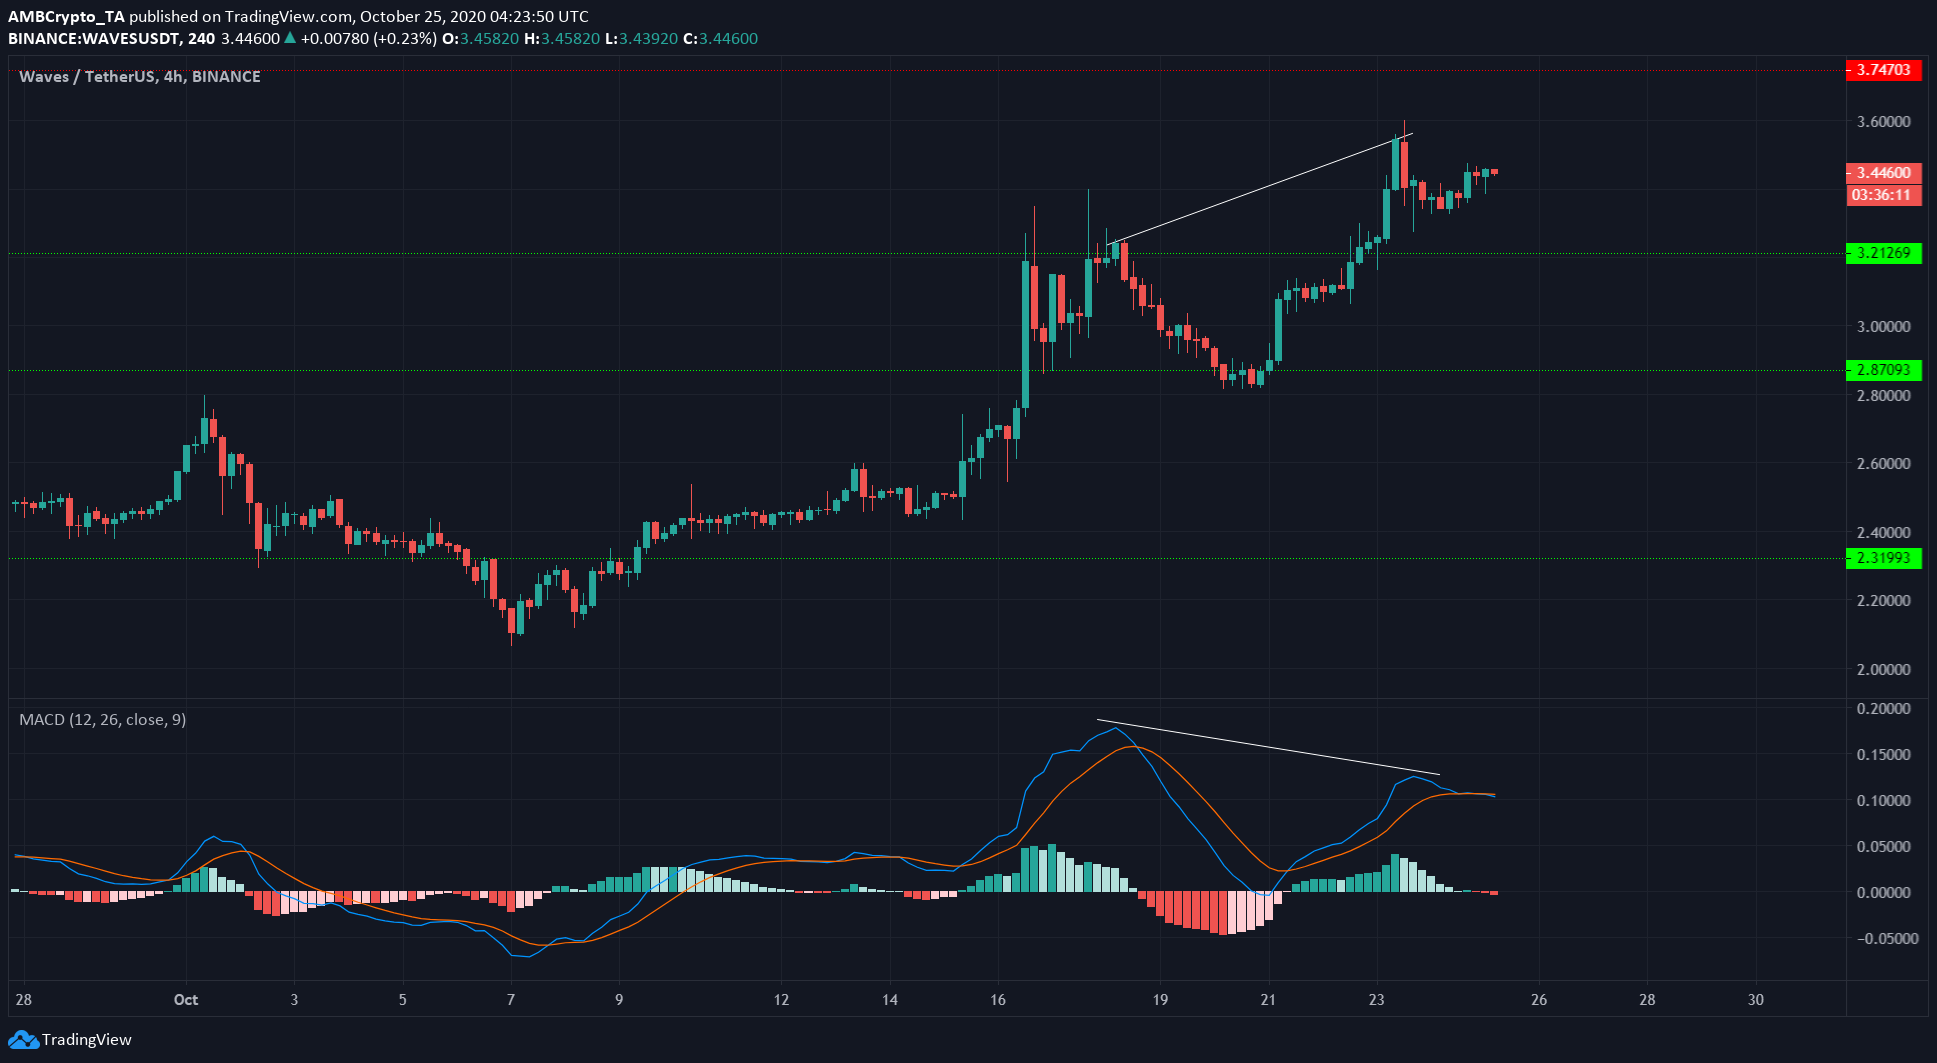
WAVES noted strong gains over the past couple of weeks as it gained and posted gains of nearly 75% in the month of October, with a local low at $2.06 and a local high at $3.59.
Its move past the $2.3-level was quite important and the crypto-asset made steady gains towards $2.6, before registering stronger bullish momentum that eventually took it beyond $3.21.
However, highlighted in white was a bearish divergence between WAVES and its momentum indicator, the MACD. WAVES can be expected to post some more losses in the near-term and it could retest $3.21 before another move north.
Dogecoin [DOGE]


Source: DOGE/USDT on TradingView
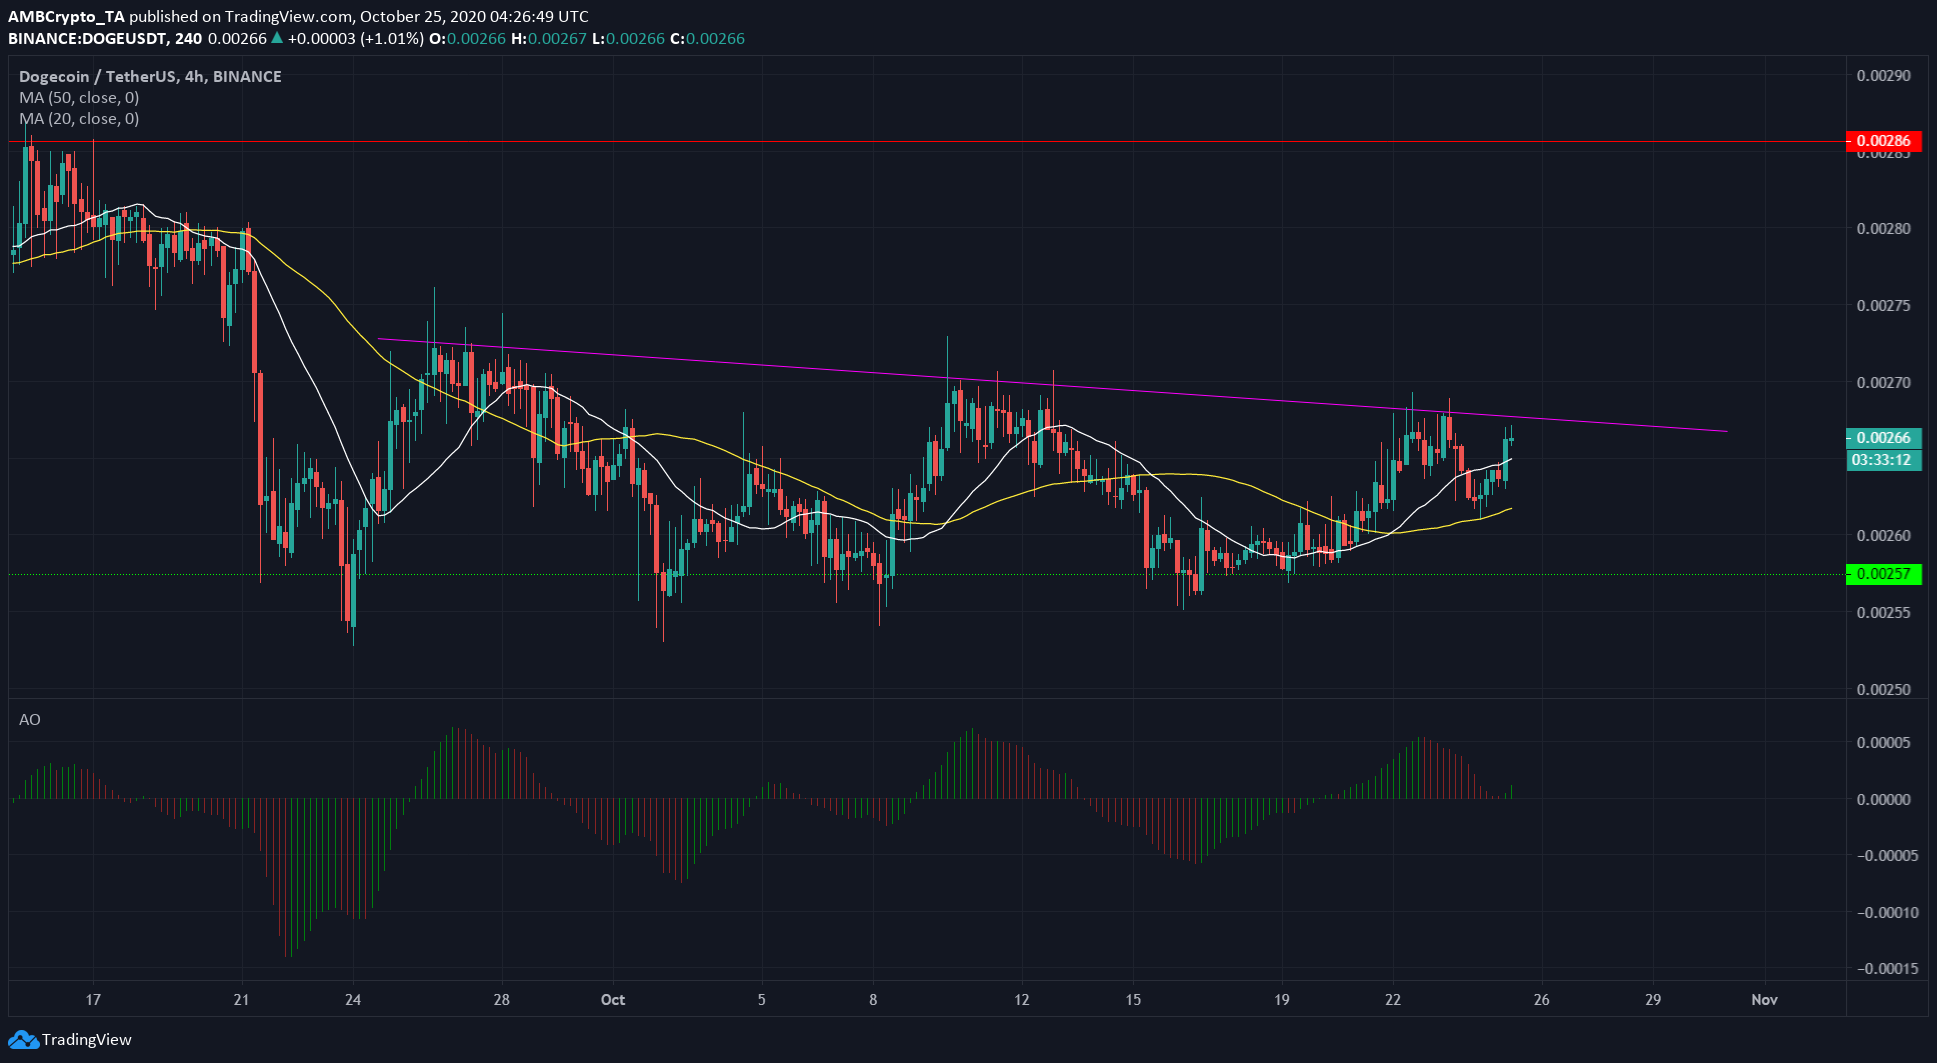
The 20 SMA (white) and the 50 SMA (yellow) highlighted the near-term momentum of the crypto-asset. At press time, it was bullish momentum, but it can be observed that over the past few months, the price has oscillated about $0.0026 with momentum to either side.
Throughout the period, it was also registering lower highs (pink), a downtrend, but weaker than the previous month’s bearishness.
A close above the descending trendline might spark some bullish sentiment for the crypto-asset, while another test of the support at $0.00257 could take the asset beneath the support level.
The post appeared first on AMBCrypto


