
Chainlink did not have strong buying interest behind it as its price appeared to break out of a continuation pattern, one that invalidated the break. Waves, on the contrary, saw rapid gains and could post more, although it also showed some important levels to watch out for in case the surge north broke down. Finally, VeChain was on a downtrend and every attempt at a reversal has proved to be a false dawn.
Chainlink [LINK]
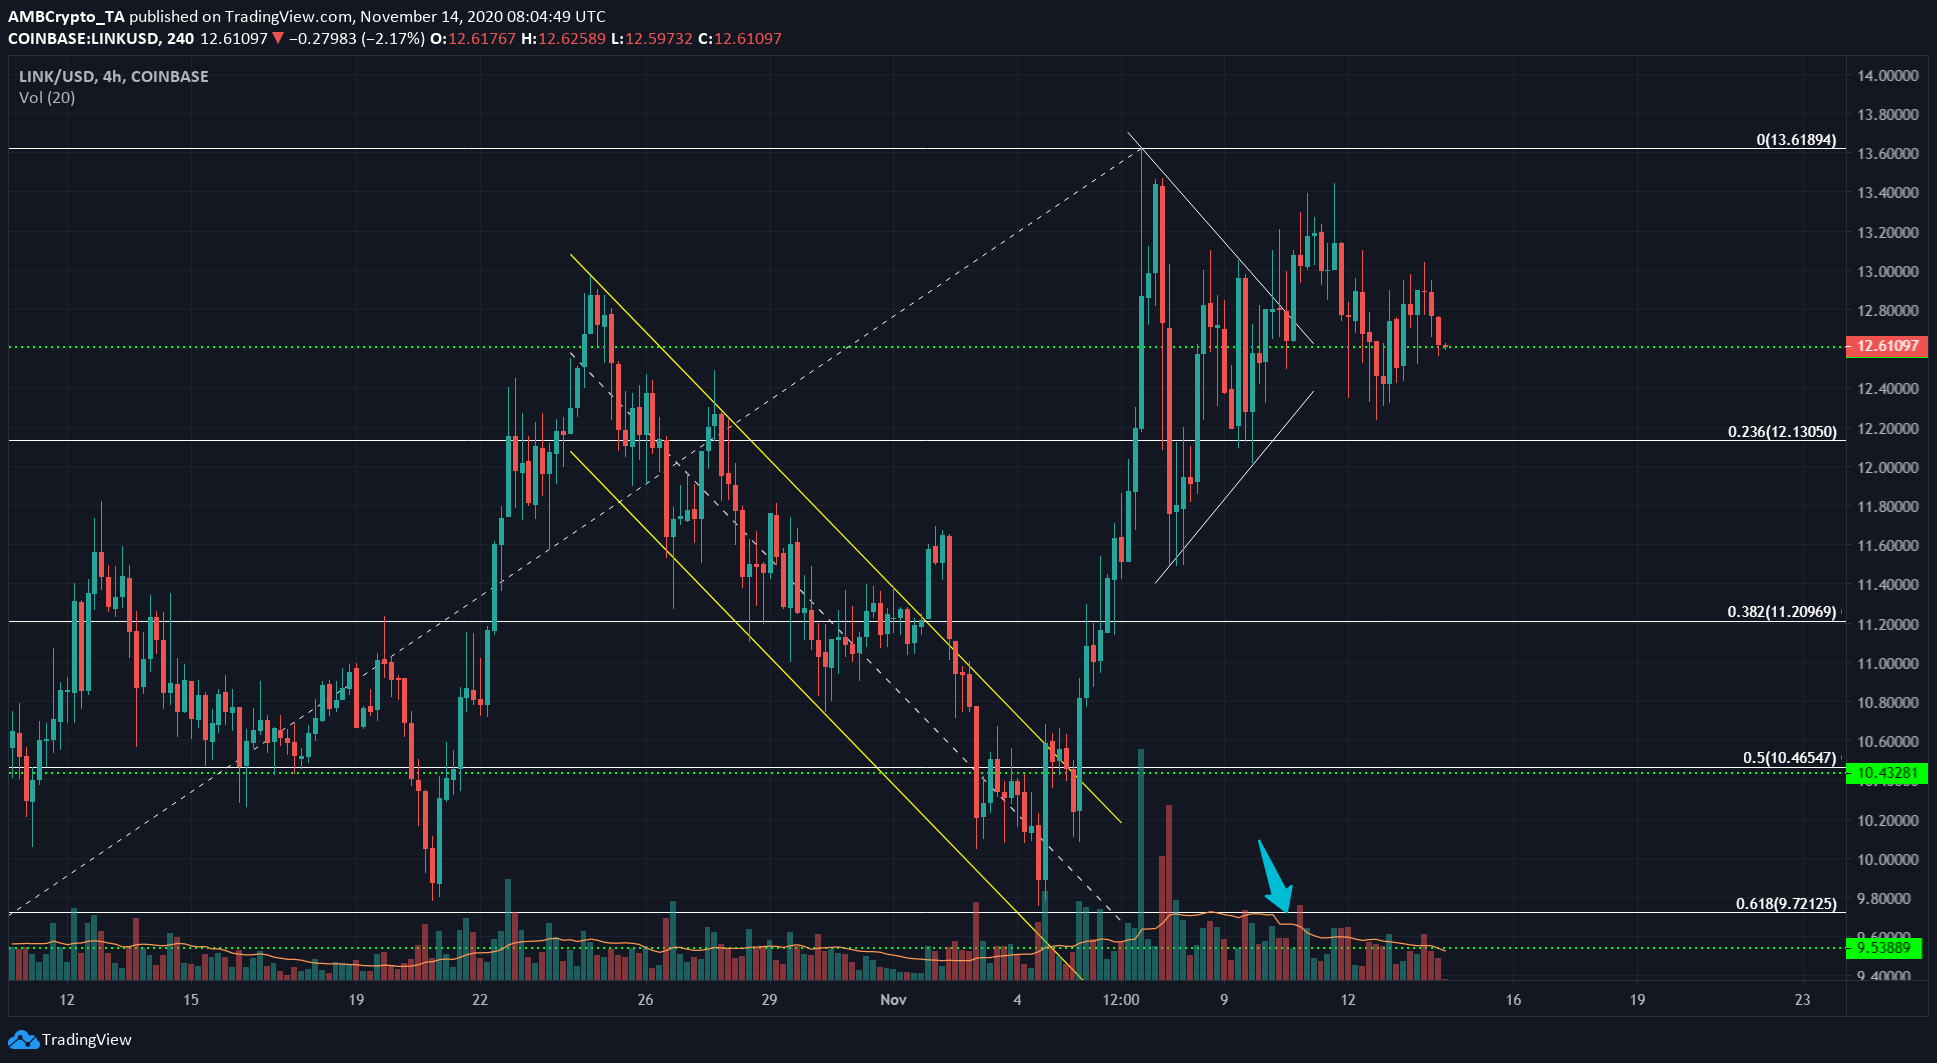
Source: LINK/USD on TradingView
Chainlink formed a bull pennant and broke out to the upside, but as indicated by the cyan arrow, the breakout was accompanied by weak trading volume.
LINK spiked from $12.6 to $13.2, but the market bulls lacked the conviction to keep the bears at bay and the price was forced under the level of support, which, at press time, it looked likely to lose once more.
A close below the support would take LINK to its next level of support at $12.13, a level which represents 23.6% retracement of LINK’s swing from $7.31 to $13.61.
In other news, Synthetix and Chainlink partnered to launch an oil derivative token, sOIL, live on Synthetix recently.
Waves [WAVES]
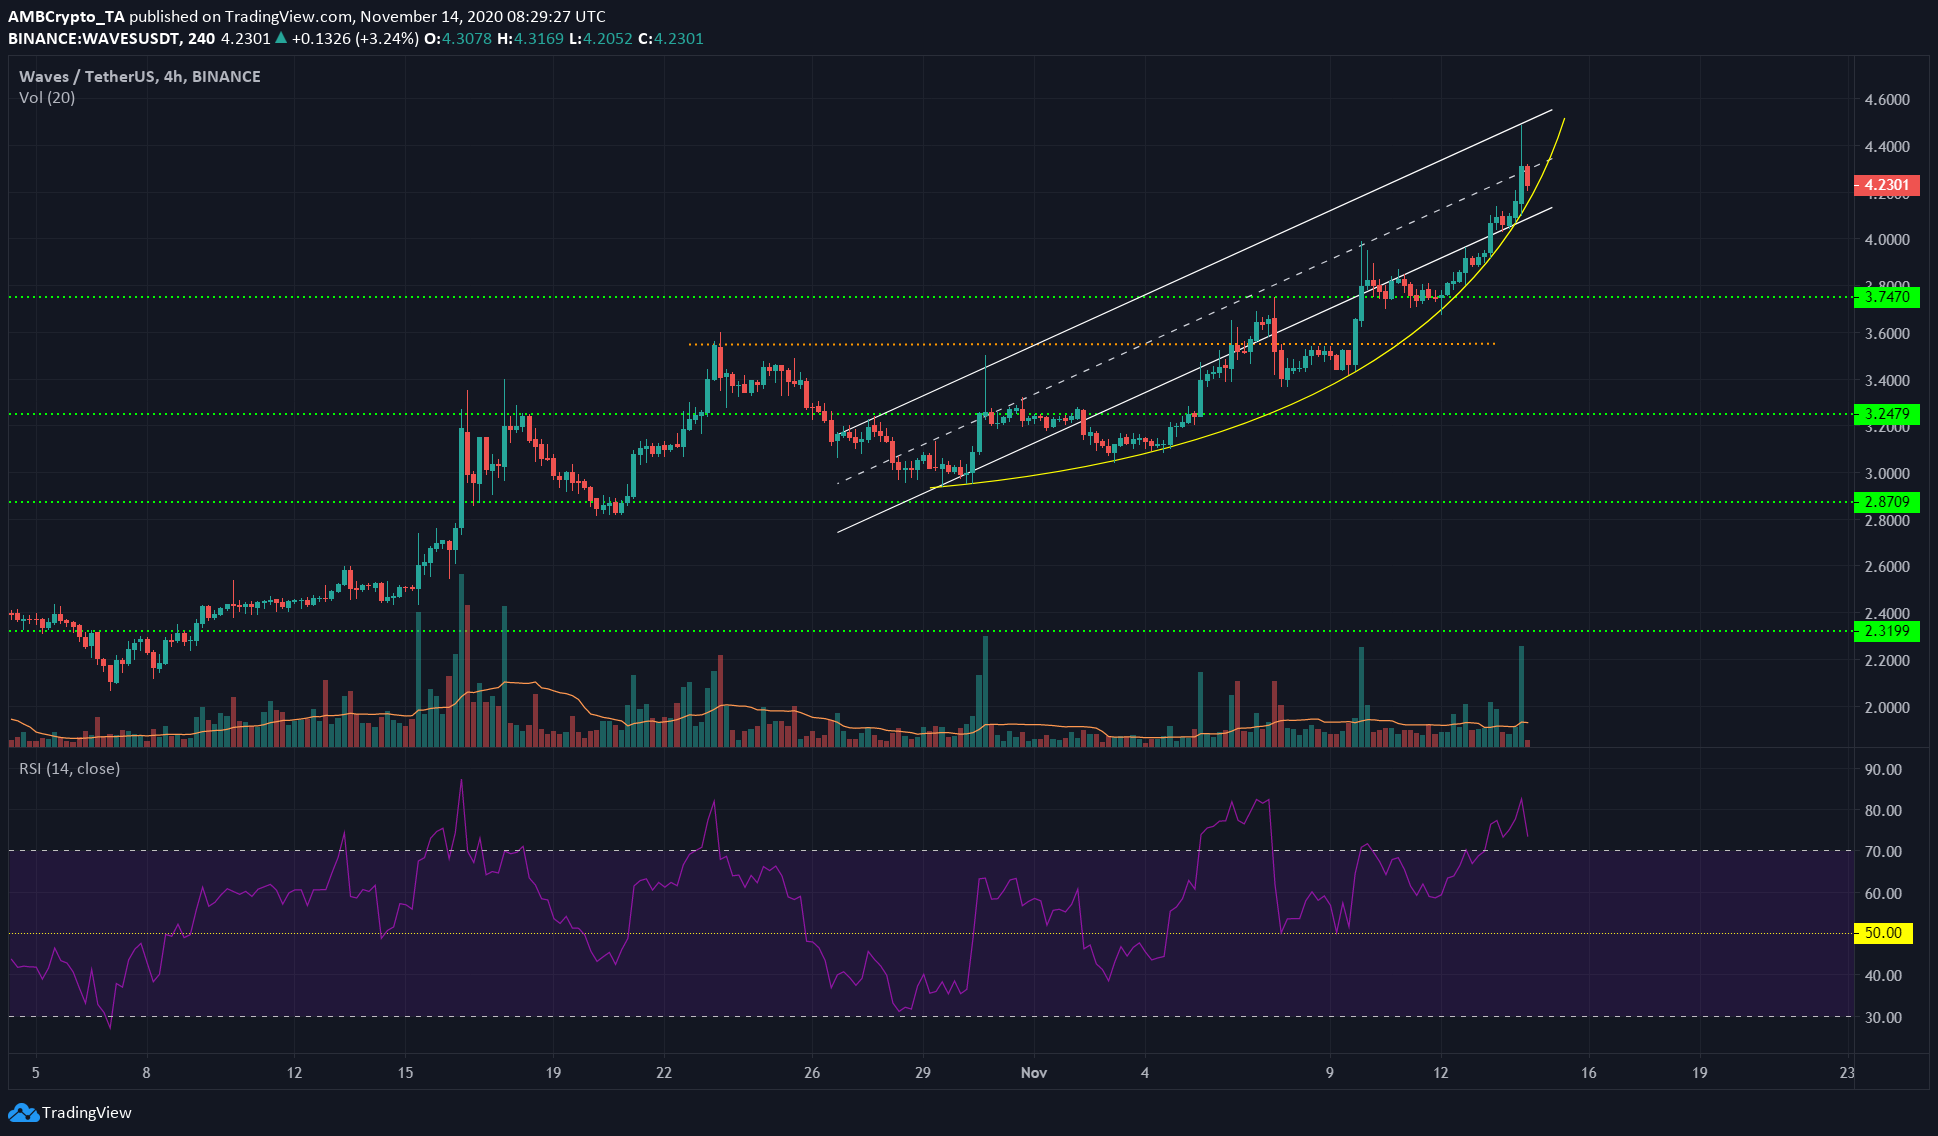
Source: WAVES/USDT on TradingView
Waves formed what appeared to be a parabolic rising curve on the charts. While this had not yet reached a panic-sell stage, the sell-off might just be a few trading sessions away.
The RSI was deep in overbought territory. This does not matter too much when strong FOMO is driving up the price, but it was something to keep in mind. The rising channel (white) also gave some important levels to watch out for, if the price sees a strong wave of selling pressure.
A drop in price below the channel and the curve could see it retest the region at $4.15 and move south once more, giving traders the confidence to enter a short position.
VeChain [VET]
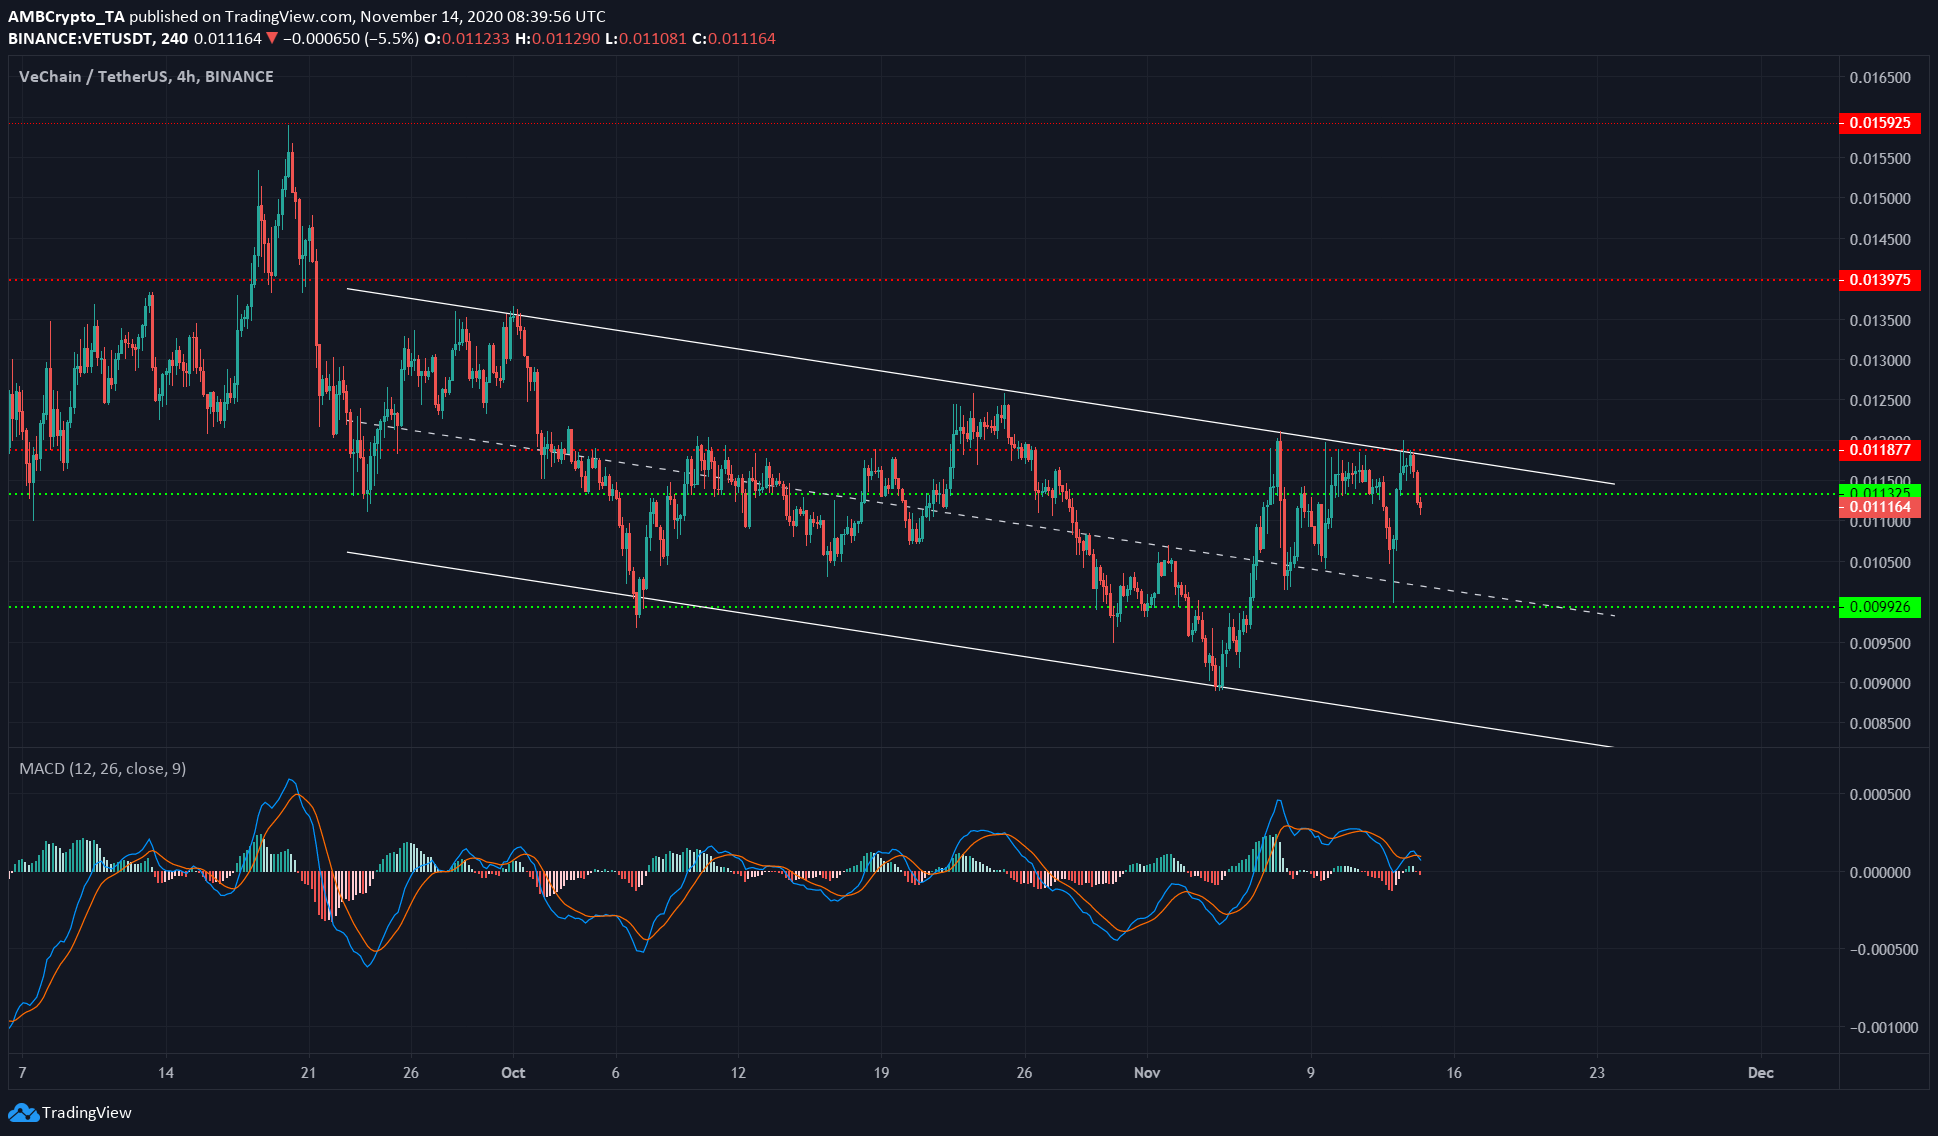
Source: VET/USDT on TradingView
On the longer timeframe, VET was moving within a descending channel. The levels of support and resistance, alongside the channel’s boundaries and middle, highlighted some key levels of importance.
At press time, the MACD had formed a bearish crossover above zero. The price also sank below the support at $0.0113, and could see the level flipped to resistance.
If bulls are unable to push the price back above $0.0113 in the coming hours, it could be headed towards support at $0.0099.
The post appeared first on AMBCrypto


