
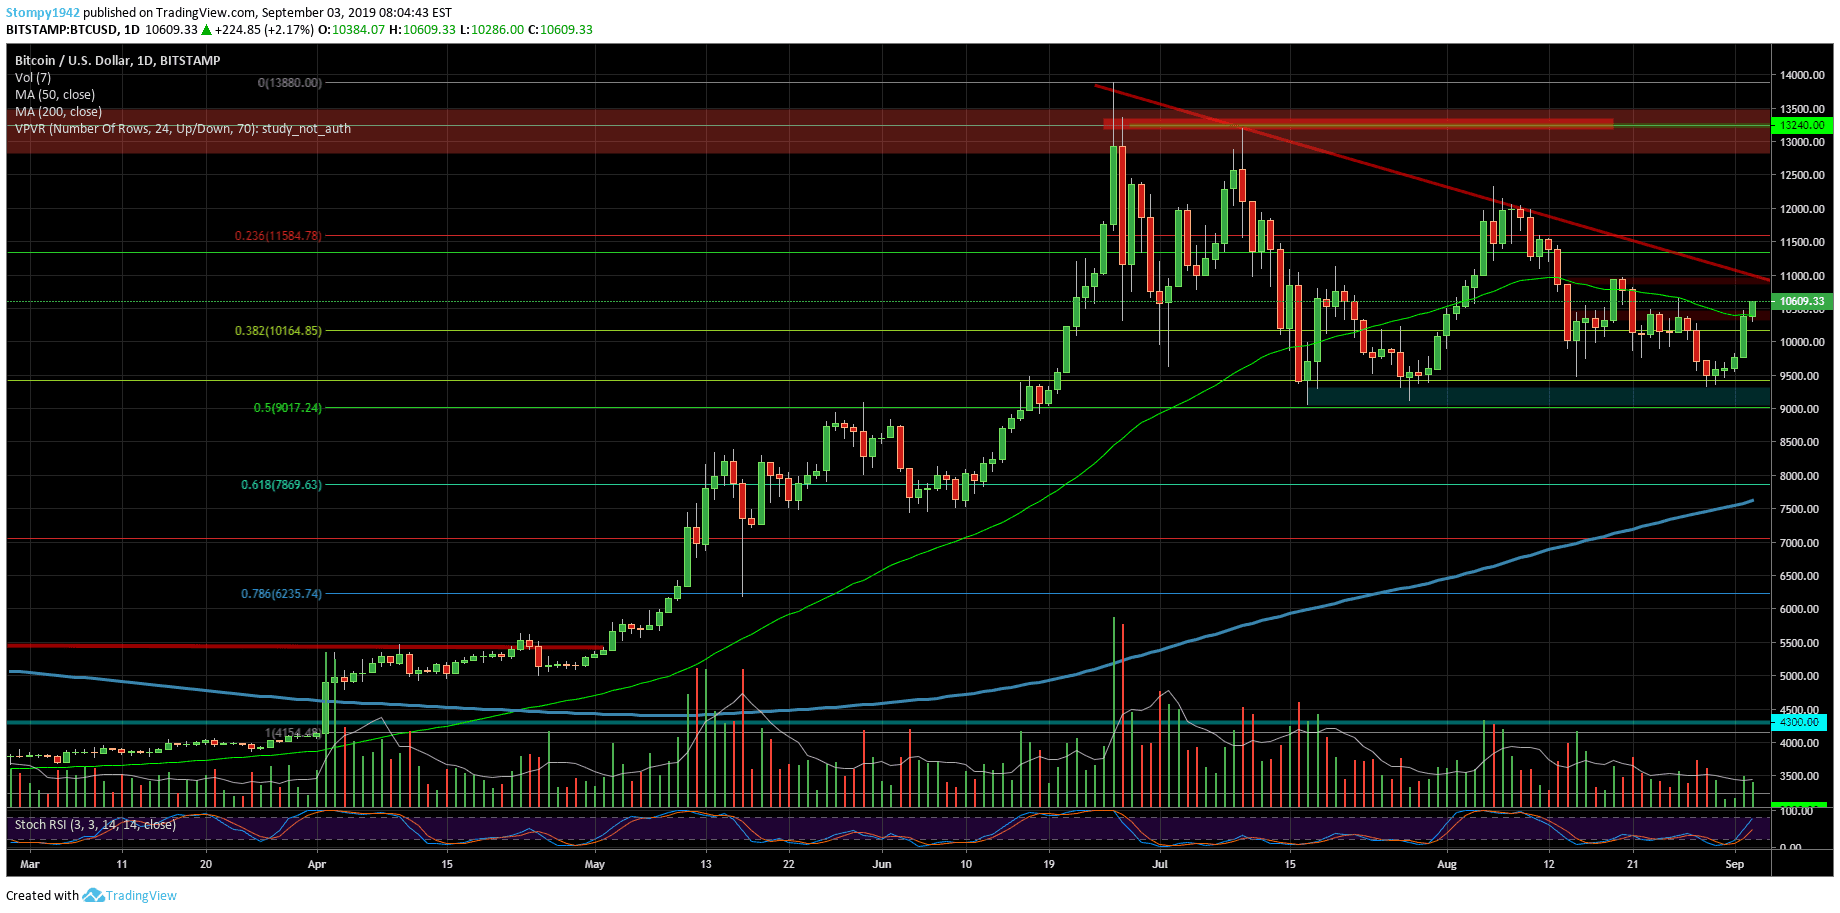
Bitcoin
Returning to the resistance levels at around $10,500 brings little confidence in the market, but as long as the price hasn’t broken the market trend line, the fear is that this movement is a trap. The resistance of the falling trend is at around $11,000, but the resistance that will change the pattern of the chart is at around $12,000. At these levels, it will be easier to talk about the end of the correction since the sharp rise which started in the middle of July. Support in this range is at around $9,300. The MA200 is also climbing as the price stays at these levels and it should be taken into consideration that the support around it in the daily graph hasn’t been tested from the time it broke up.
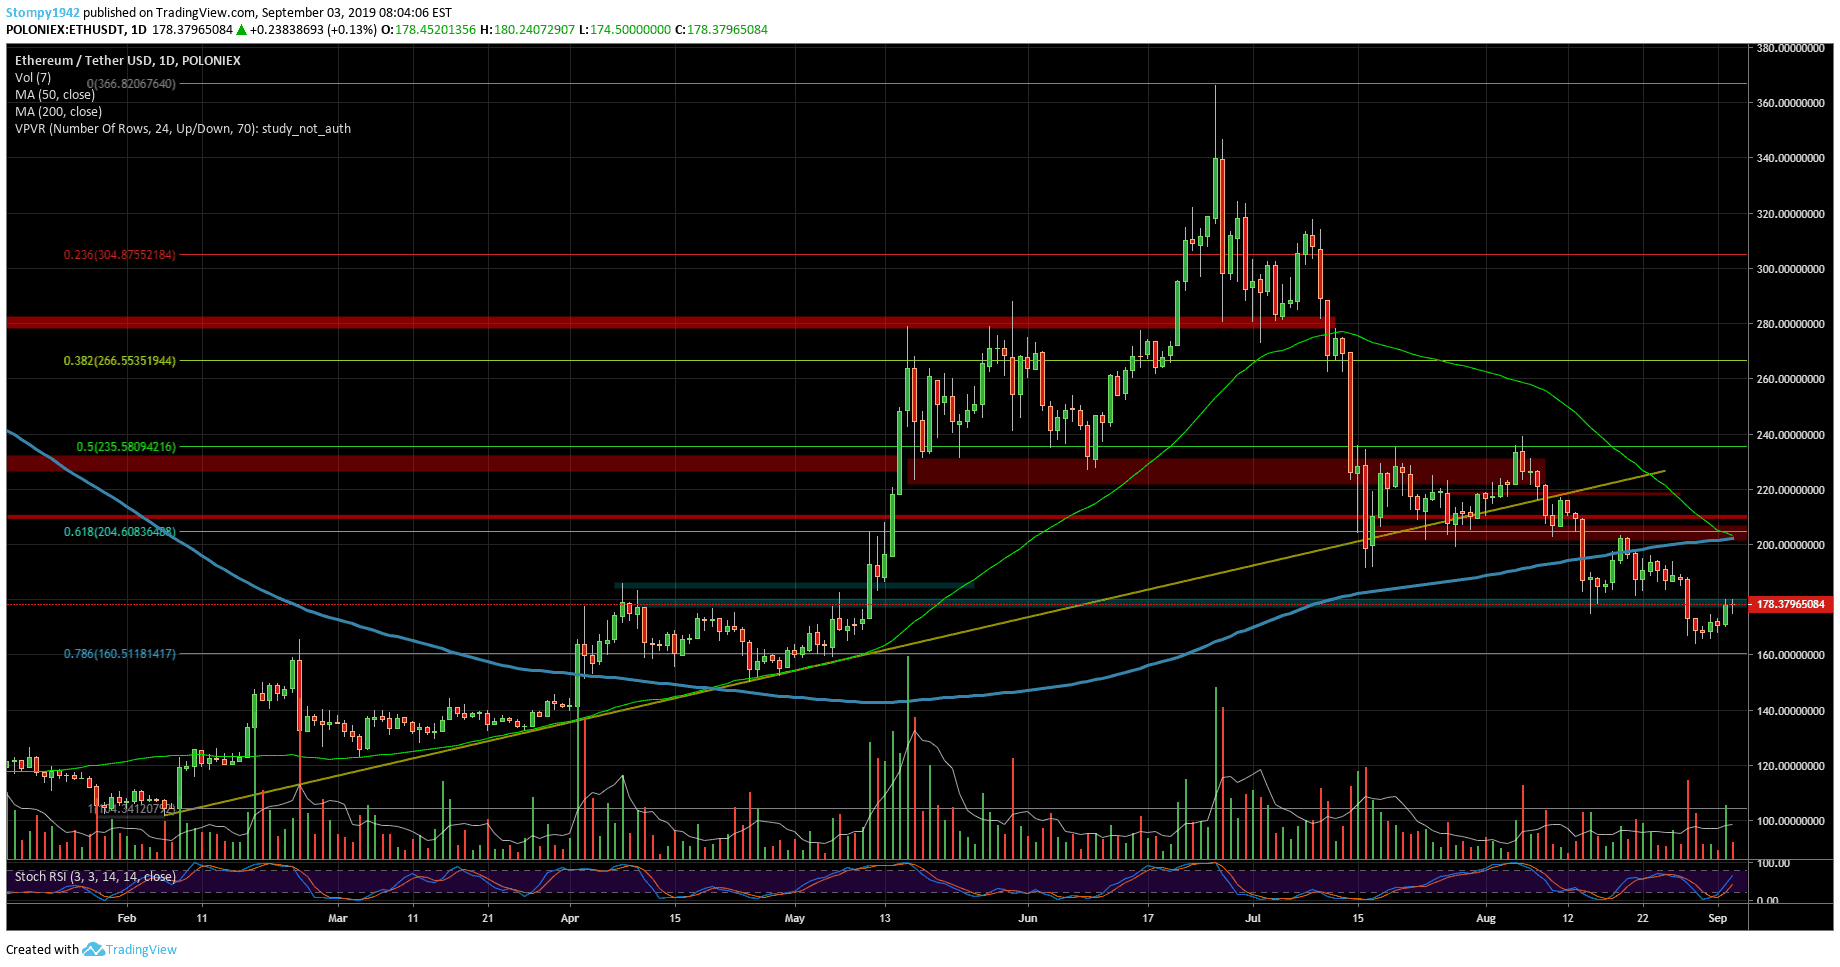
Ethereum
Against the USD, the support around $180 broke down and the price plummeted to $163 where we can see support in this range. We saw an attempt to return to the levels of $180, following Bitcoin’s latest surge, where we can also see resistance for this range. The next resistance is found at $190. The chart also displays a head and shoulders pattern in addition to losing the trend but it didn’t reach new lows this year.
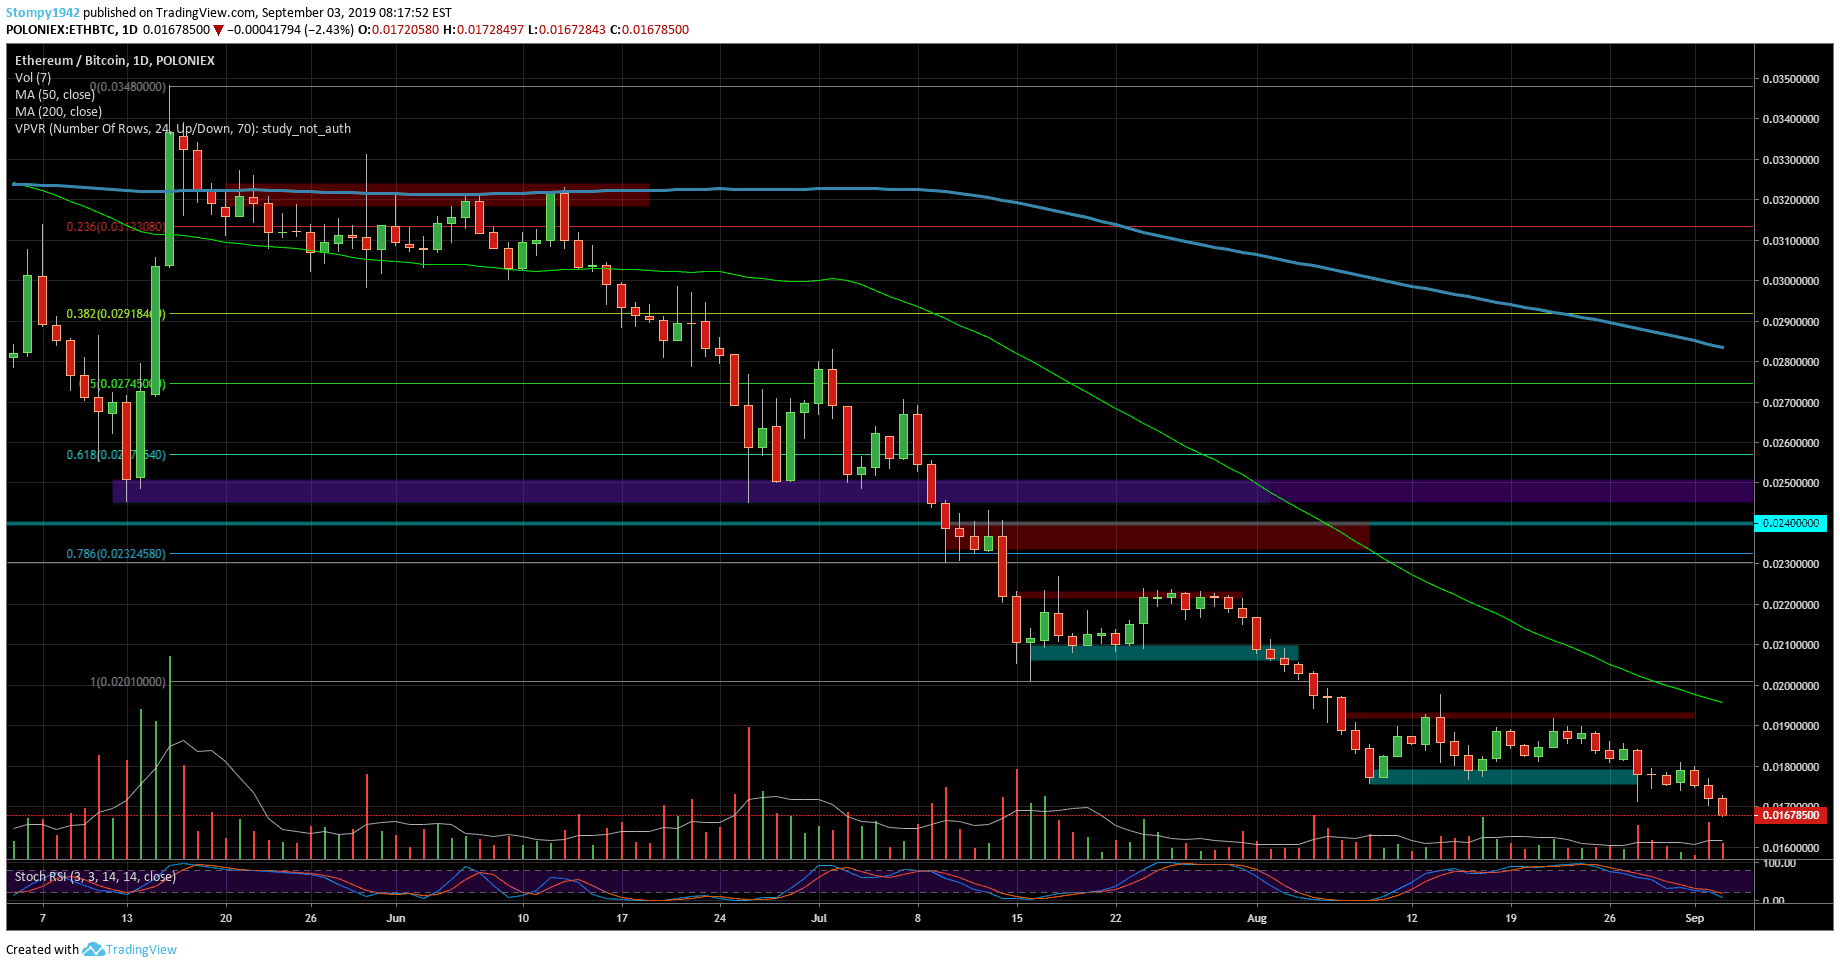
Against Bitcoin, the price looks like an elevator that just goes down another floor and the road back already seems almost impossible. It reached lows we haven’t seen since February 2017. The question is if this is an opportunity or if it will go down any further. Support for this range can be found at 0.016BTC. Resistance is at 0.019BTC. If the price manages to break through the 50MA levels, this will bring confidence to the market.
Ripple
Against the USD, the support around 25 cents still holds. Resistance in this range is at 28 cents. The trading volume has fallen and the fear index seems to be rising at these levels.
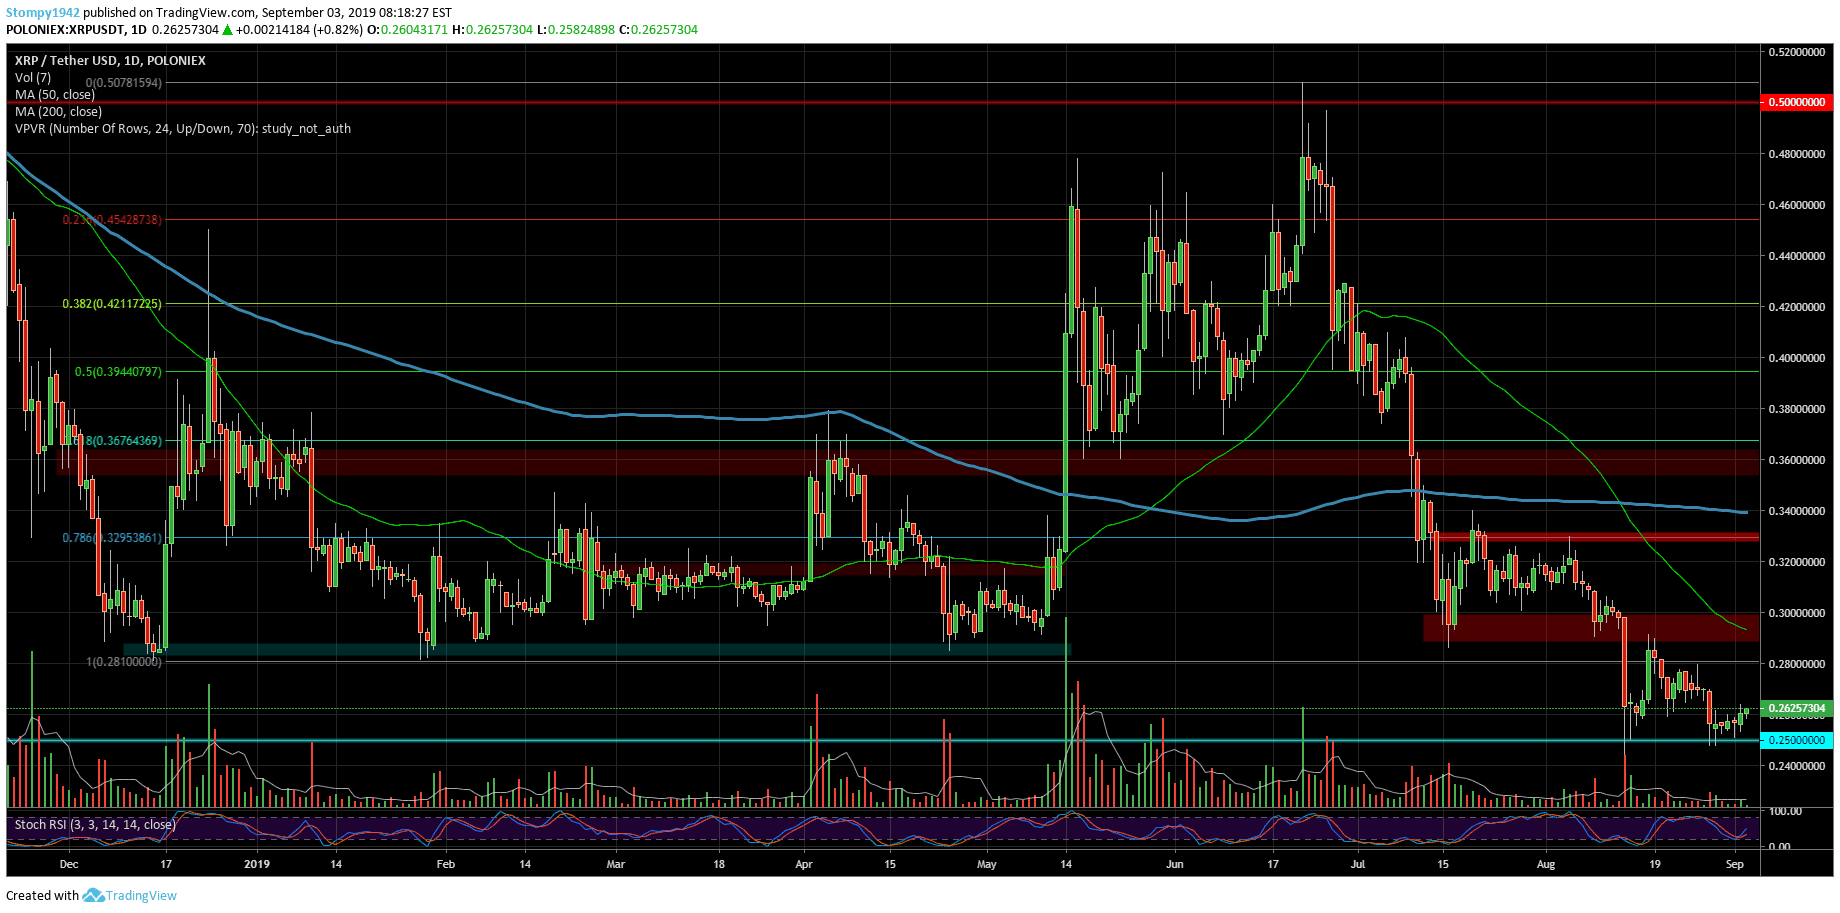
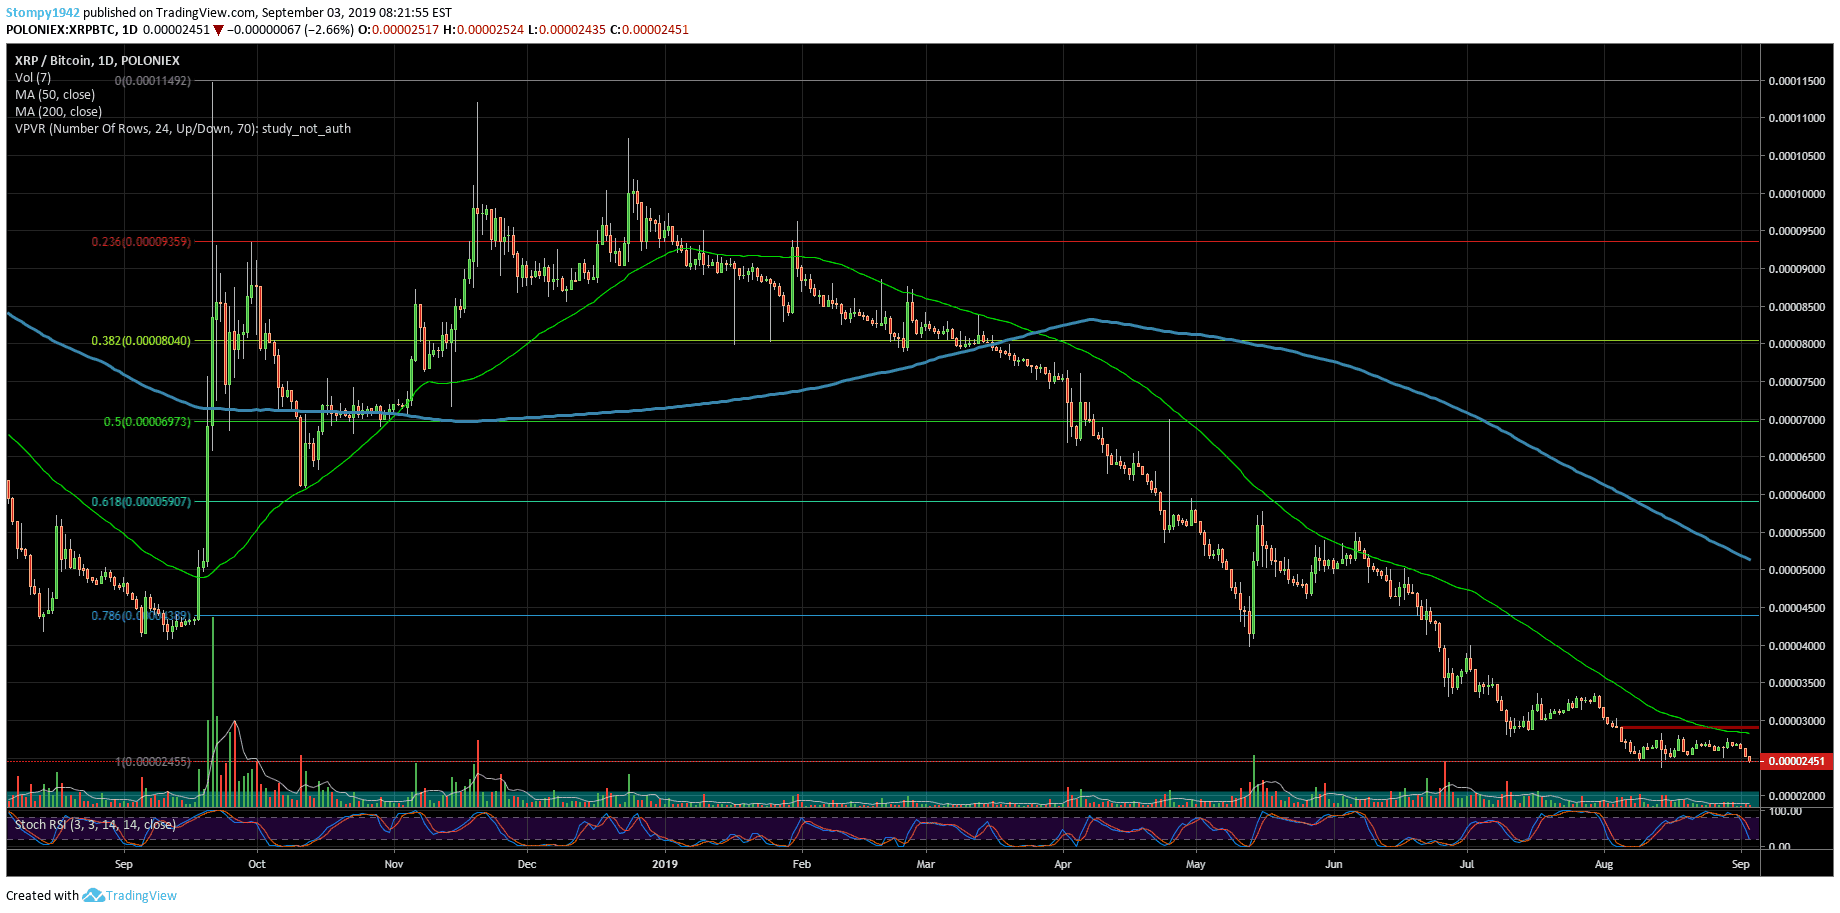
Against Bitcoin, support levels are found around 2400 SAT and they still hold. Resistance in this range is at around the 50MA at 2800 SAT.
Grin
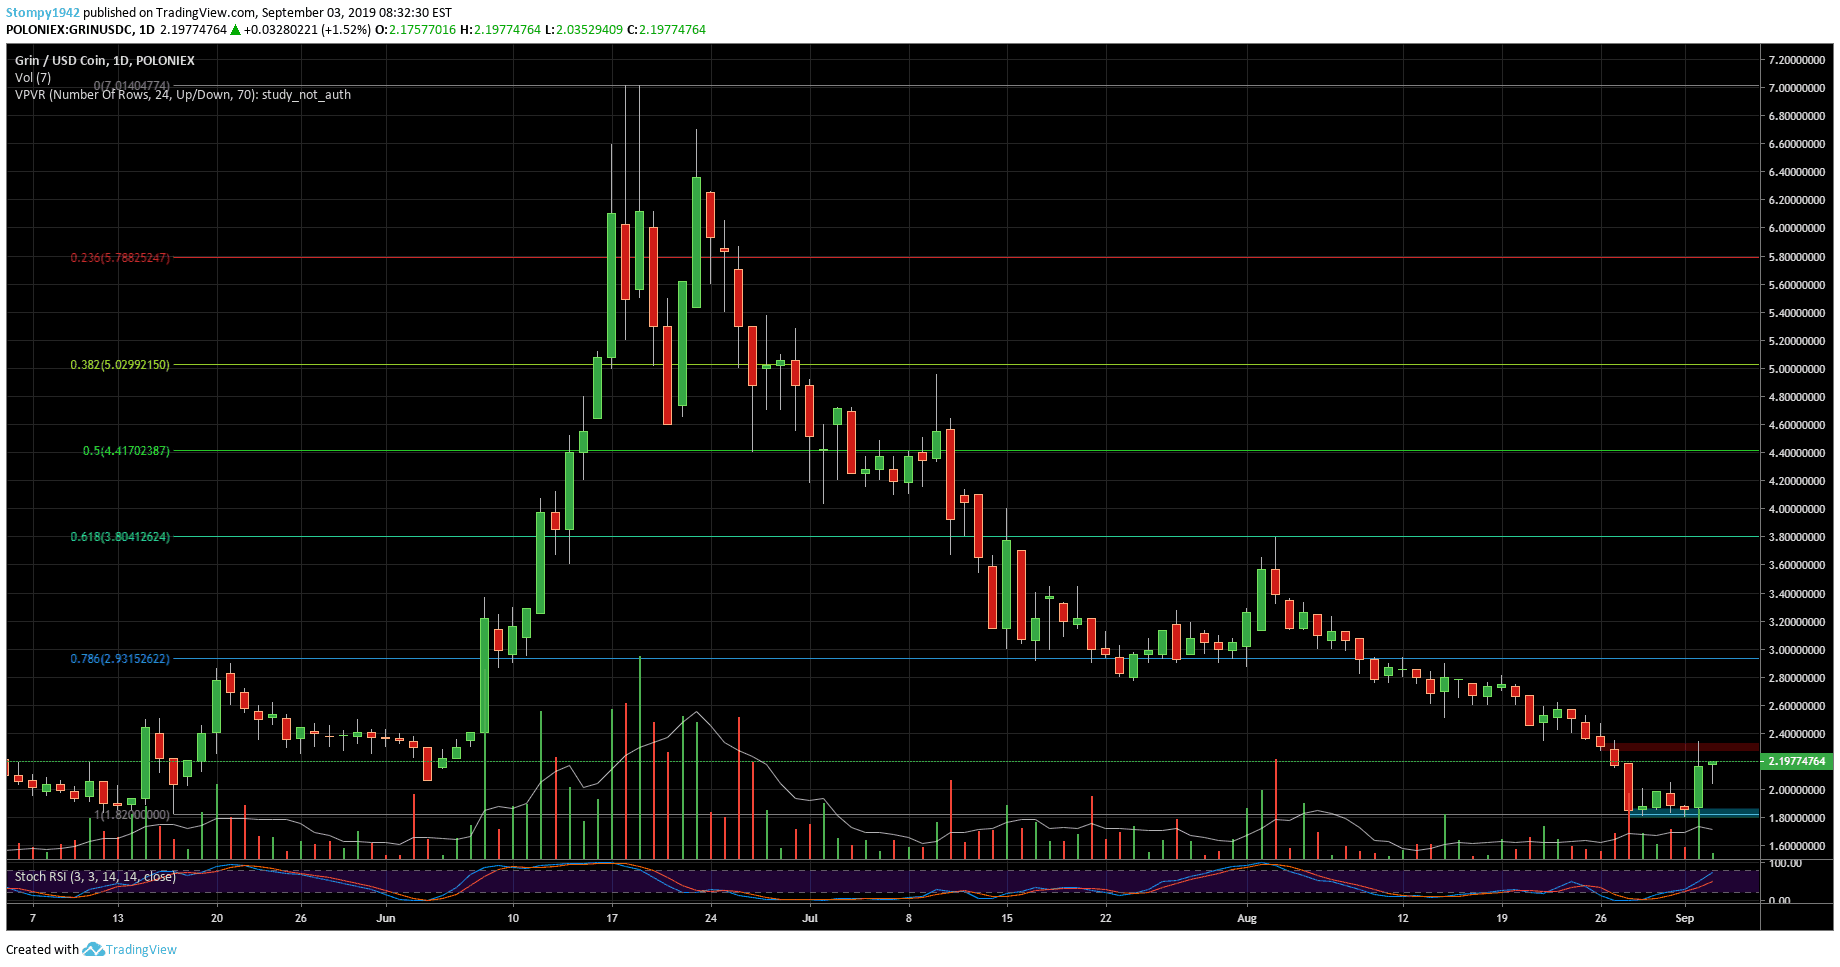
Against the USD, the $7 price increase was quickly erased and Grin returned to the support areas at around $1.8. The resistance in this range is around $2.2. If the increase in Bitcoin continues, we may also look for resistance at $2.9.
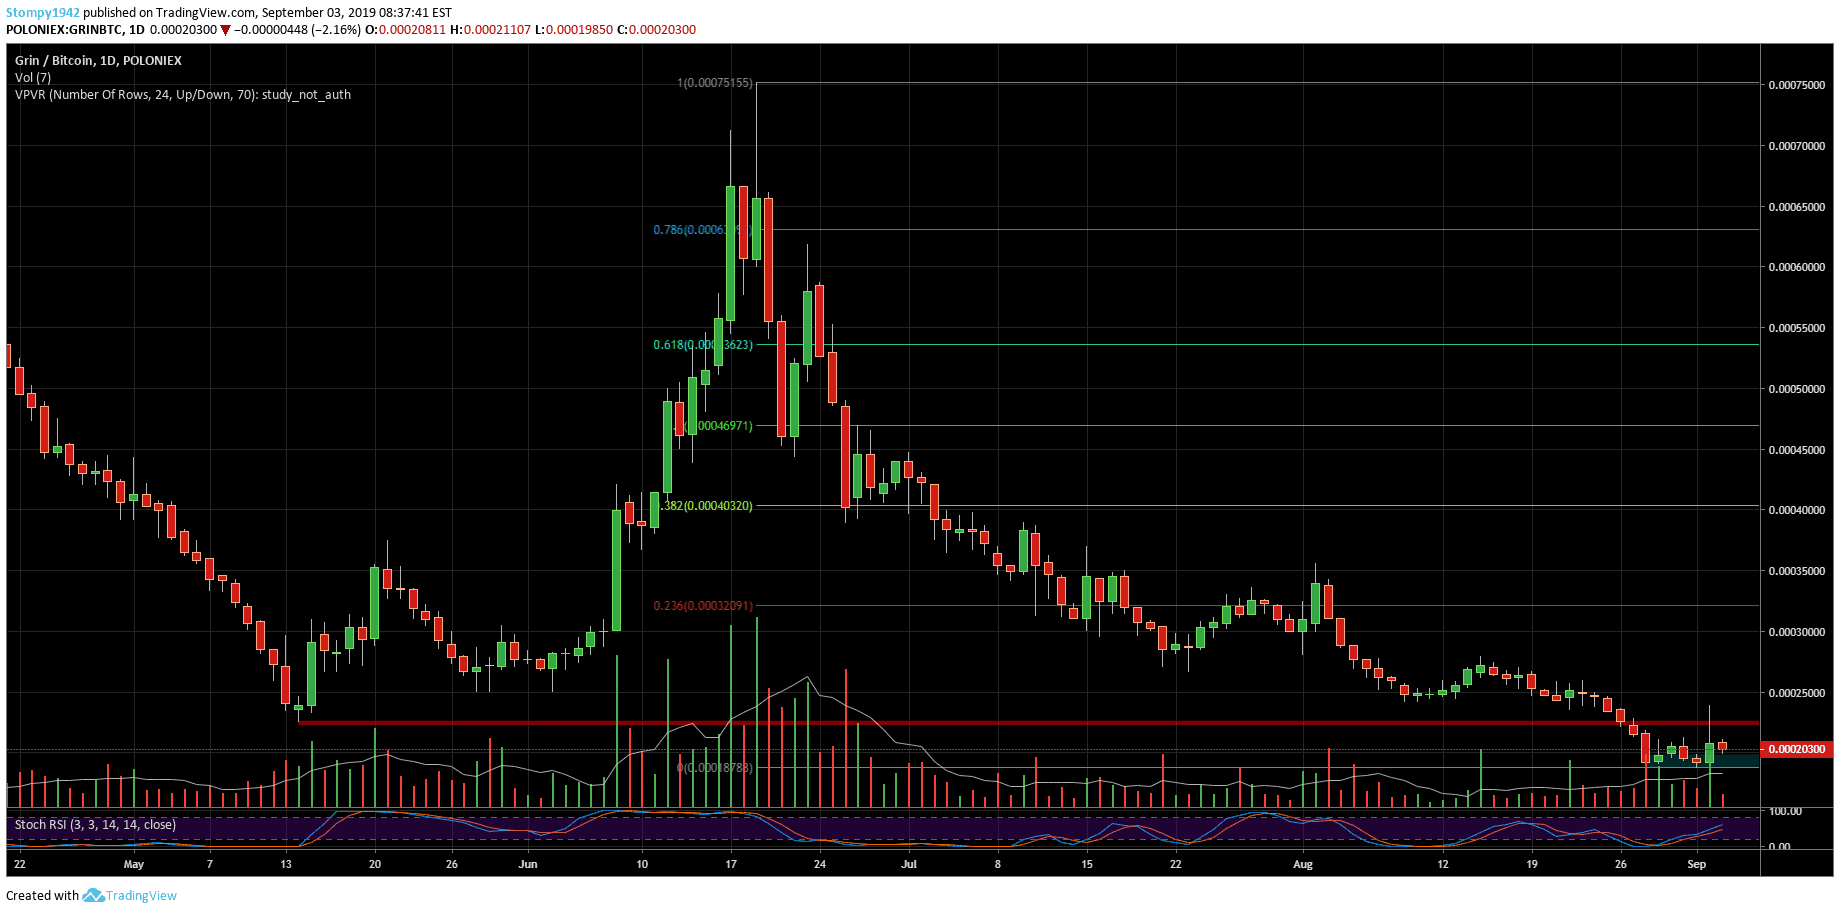
Against BTC, the price completed a downward correction after the increase we saw in June where we saw a high of 0.00075BTC. Currently, the support for the cryptocurrency is at 0.00018BTC. The resistance in the range is around 0.00023BTC.
Wanchain
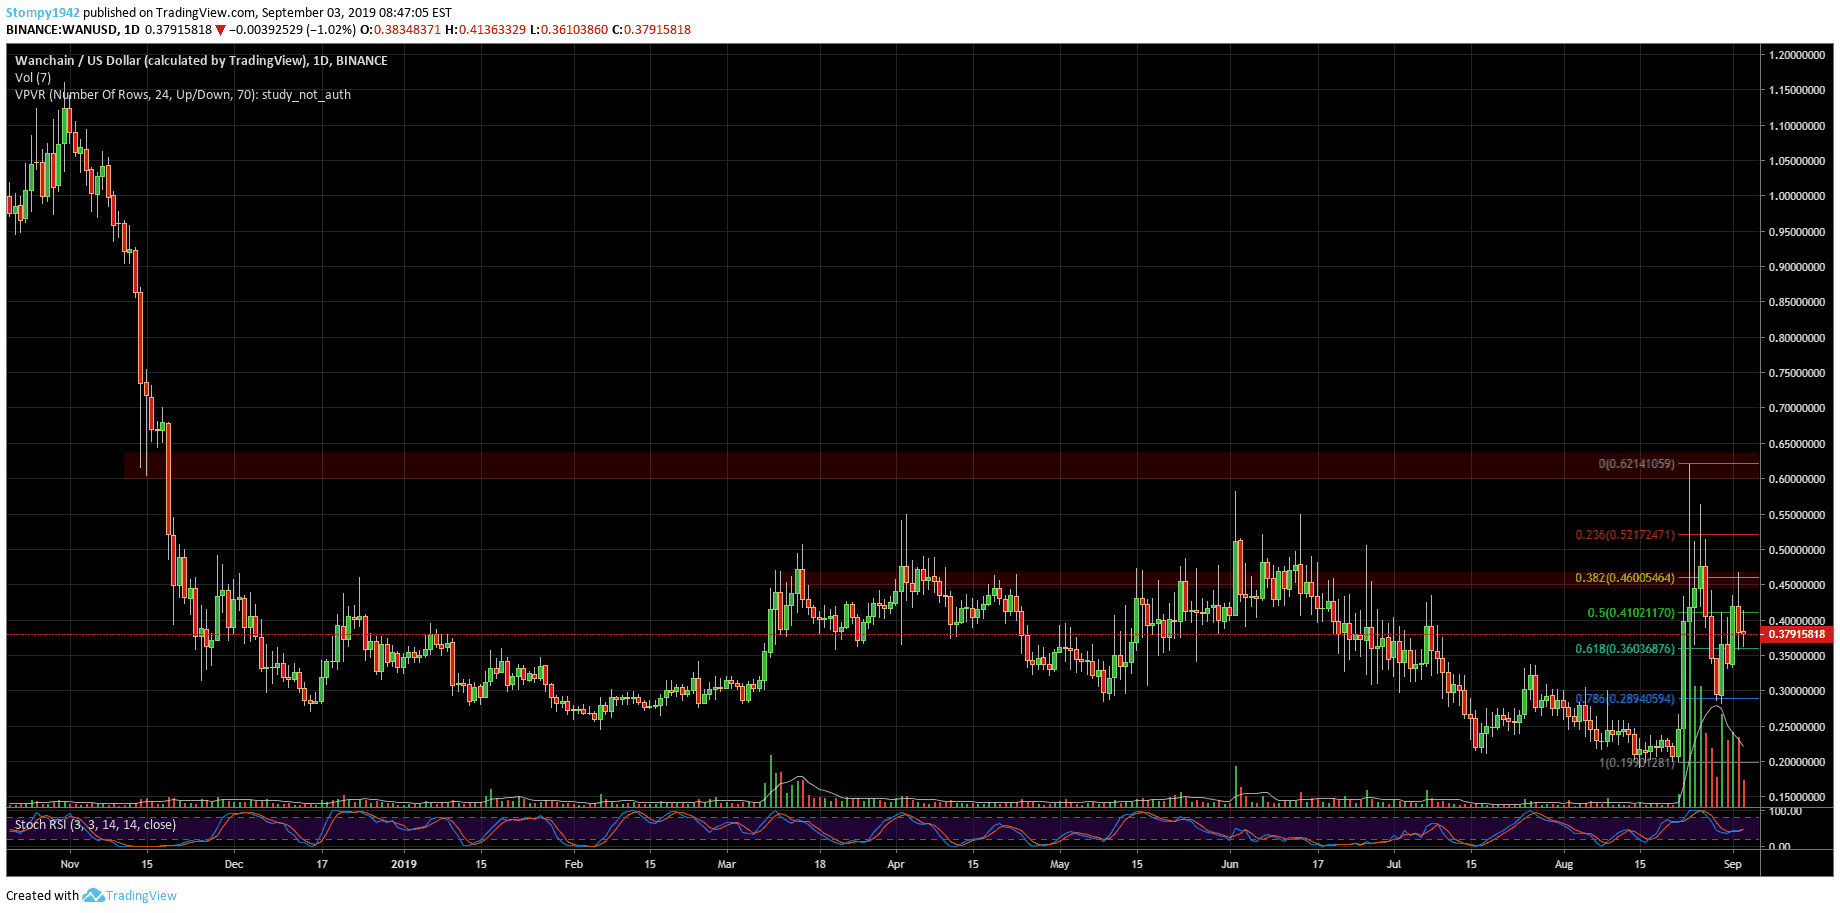
Against the USD, we saw a sharp increase in volume which led to a serious jump from 20 cents to 62 cents. From there, the price corrected as the volume dropped and we can see support at around 35 cents. The resistance is at around 45 cents.
Against Bitcoin, the chart is slightly similar and we can see the bottom at 2000 SAT. Following the sharp increase to 6000 SAT and the correction, the support in this range is at around 3000 SAT while the resistance is at 4000 SAT.

More news for you:


The post appeared first on CryptoPotato


