
Bitcoin
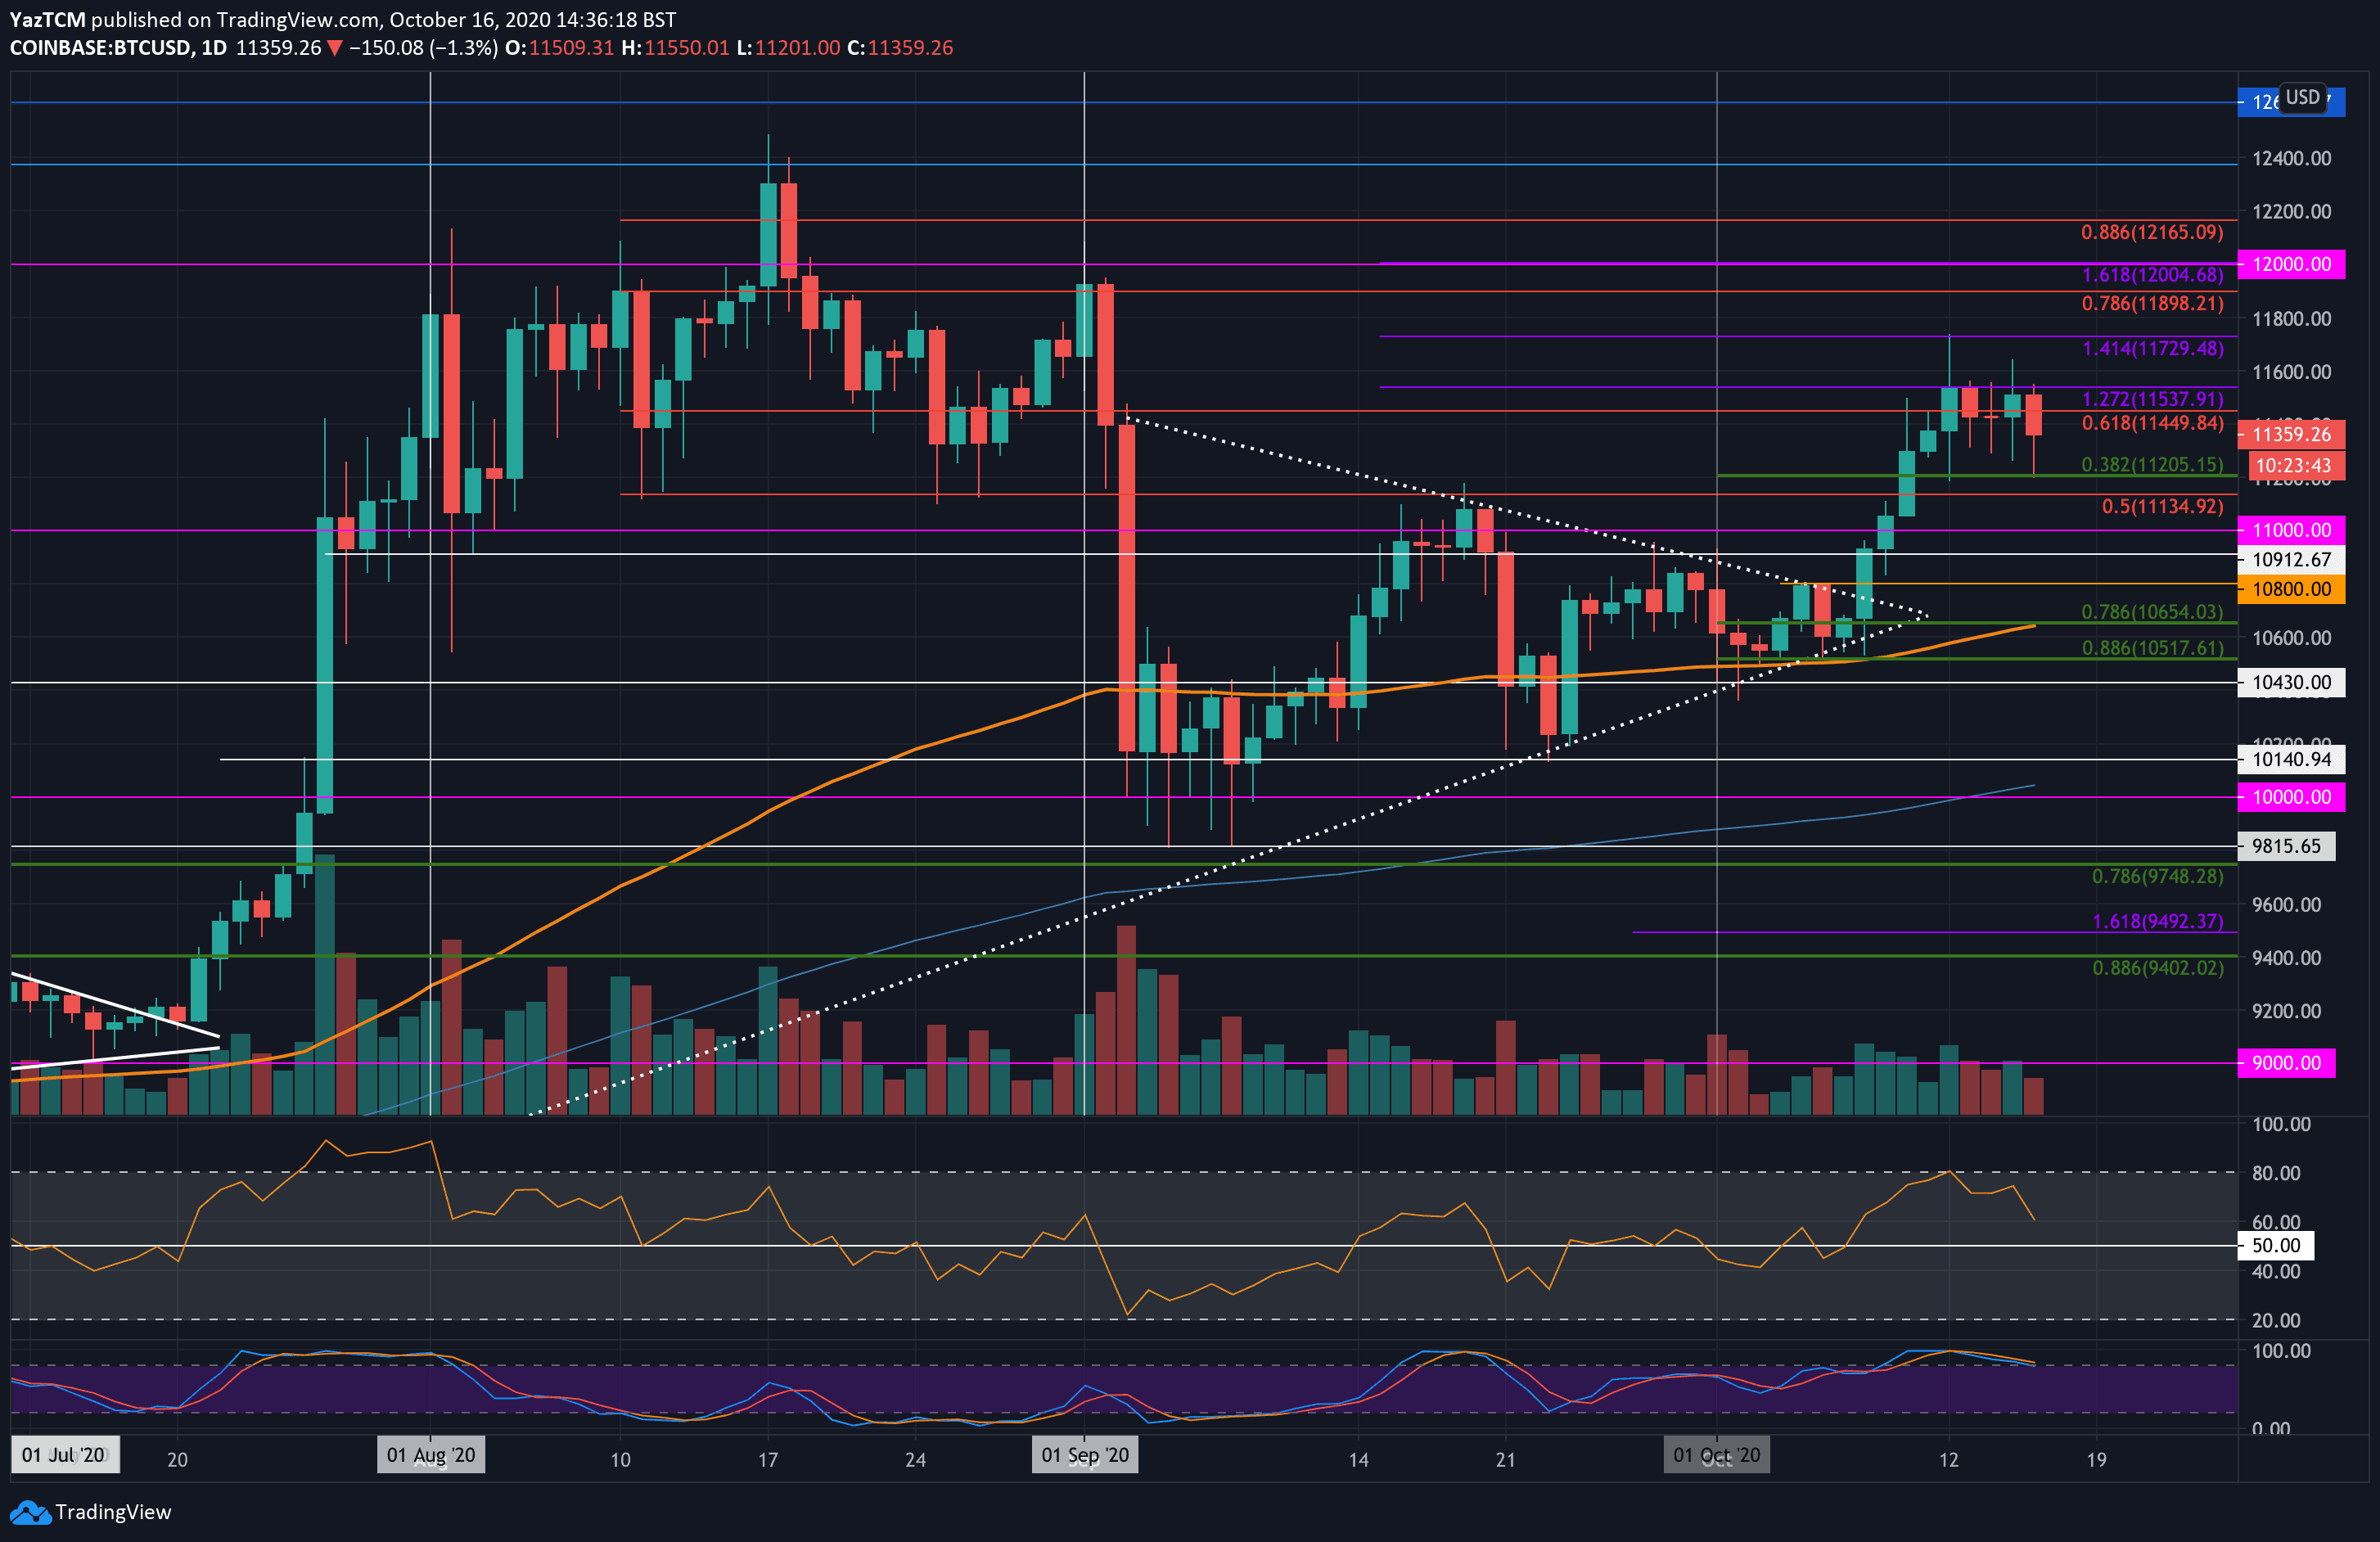
Bitcoin saw a 4.3% price surge over the past seven days. The cryptocurrency was trading slightly above $11,000 last Friday as it started to push higher. Throughout the week, it managed to spike as high as $11,730 (1.414 Fib extension) but was never able to close a daily candle above resistance at $11,537 (provided by a 1.272 Fib Extension).
Today, with the announcement that OKEx had halted their withdrawals, BTC took a tumble. It spiked into the support at $11,200 – provided by a .382 Fib Retracement. It has since rebounded to trade at $11,360.
Moving forward, if the bulls continue to push back above $11,500, resistance lies at $11,537 (1.272 Fib Extension), $11,600, and $11,729 (1.414 Fib Extension). Beyond this, additional resistance lies at $11,800, $11,900 (bearish .786 Fib Retracement), and $12,000.
On the other side, the first level of support lies at $11,200 (.382 Fib). Beneath this, support is found at $11,135, $11,000, and $10,912. Added support is expected at $10,912 and $10,800.
Ethereum
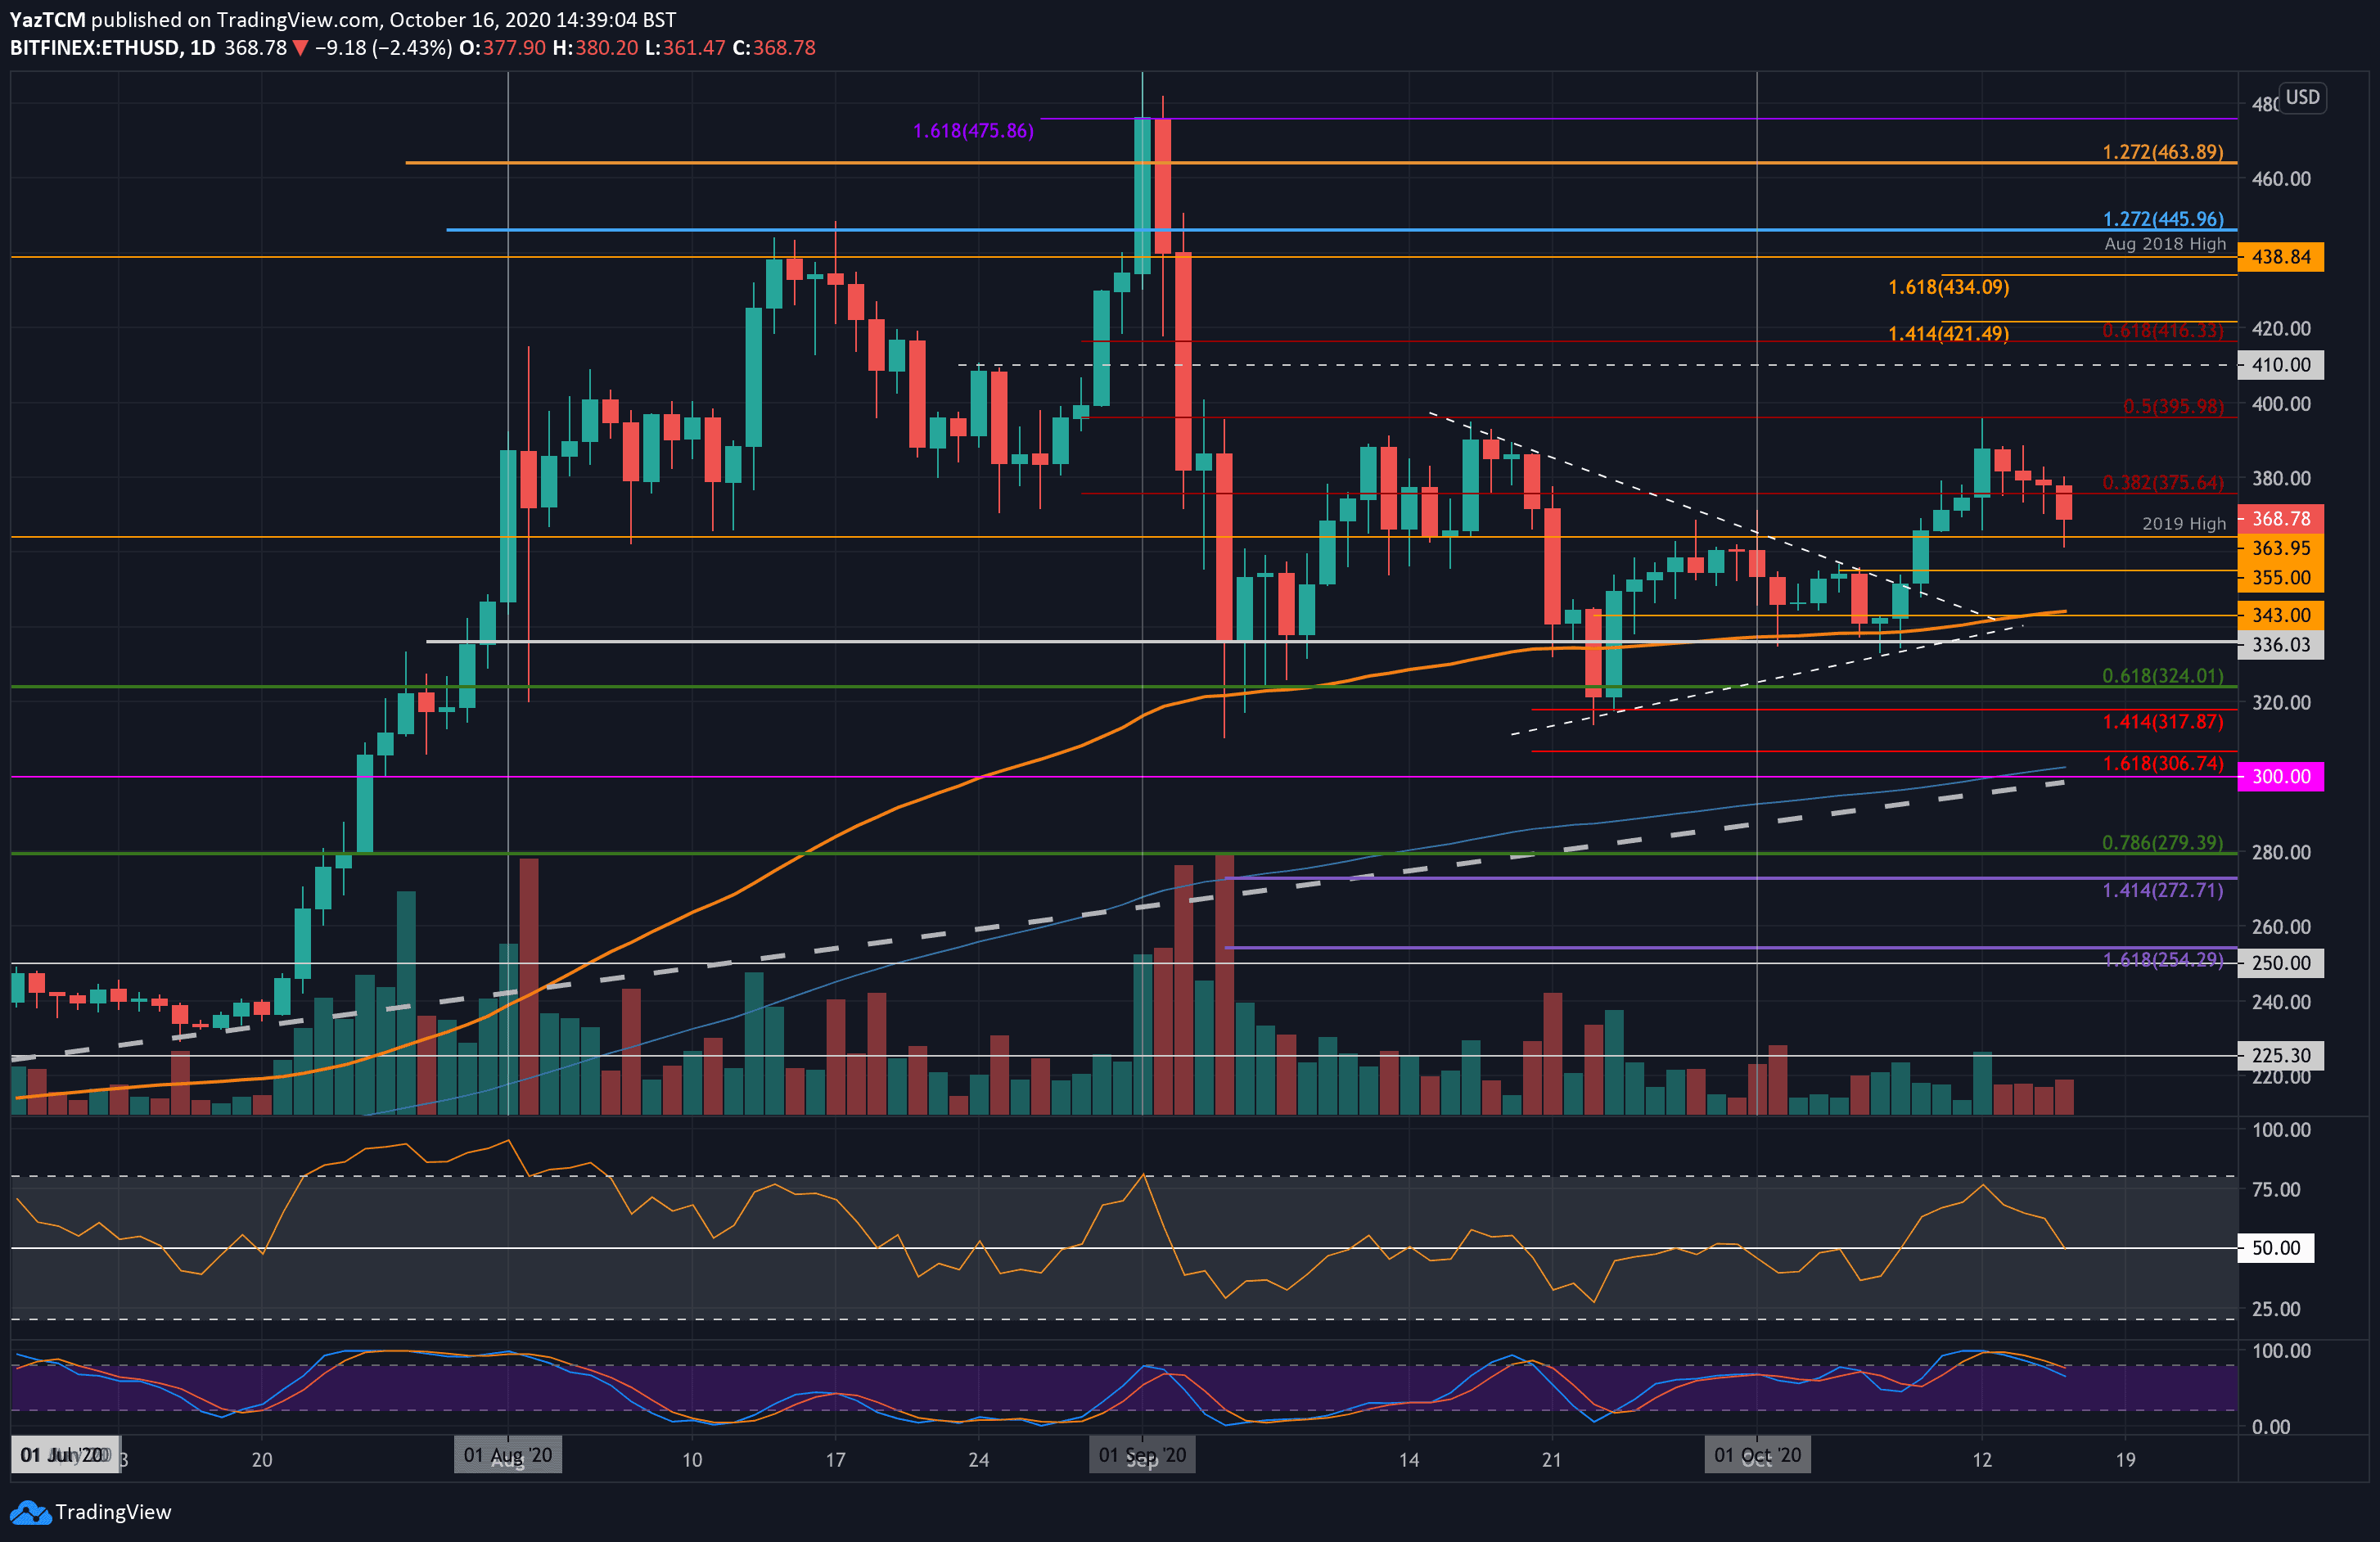
Ethereum witnessed a 5.5% price rise over the past seven days. The cryptocurrency was trading around $364 last Friday after it managed to penetrate above a symmetrical triangle pattern.
From there, Ethereum started to climb higher throughout the weekend and reached the resistance at $386 (bearish .5 Fib Retracement) on Monday. Unfortunately, it rolled over from here and started to head lower during the week as it dropped as low as $360 today.
Looking ahead, if the sellers push back beneath $394 (2019 high), the first level of support lies at $355. Beneath this, support is found at $343 (100-days EMA), $336, and $320.
On the other side, if the buyers regroup and push higher, resistance first lies at $380. Above this, resistance lies at $396 (bearish .5 Fib), $400, and $410.
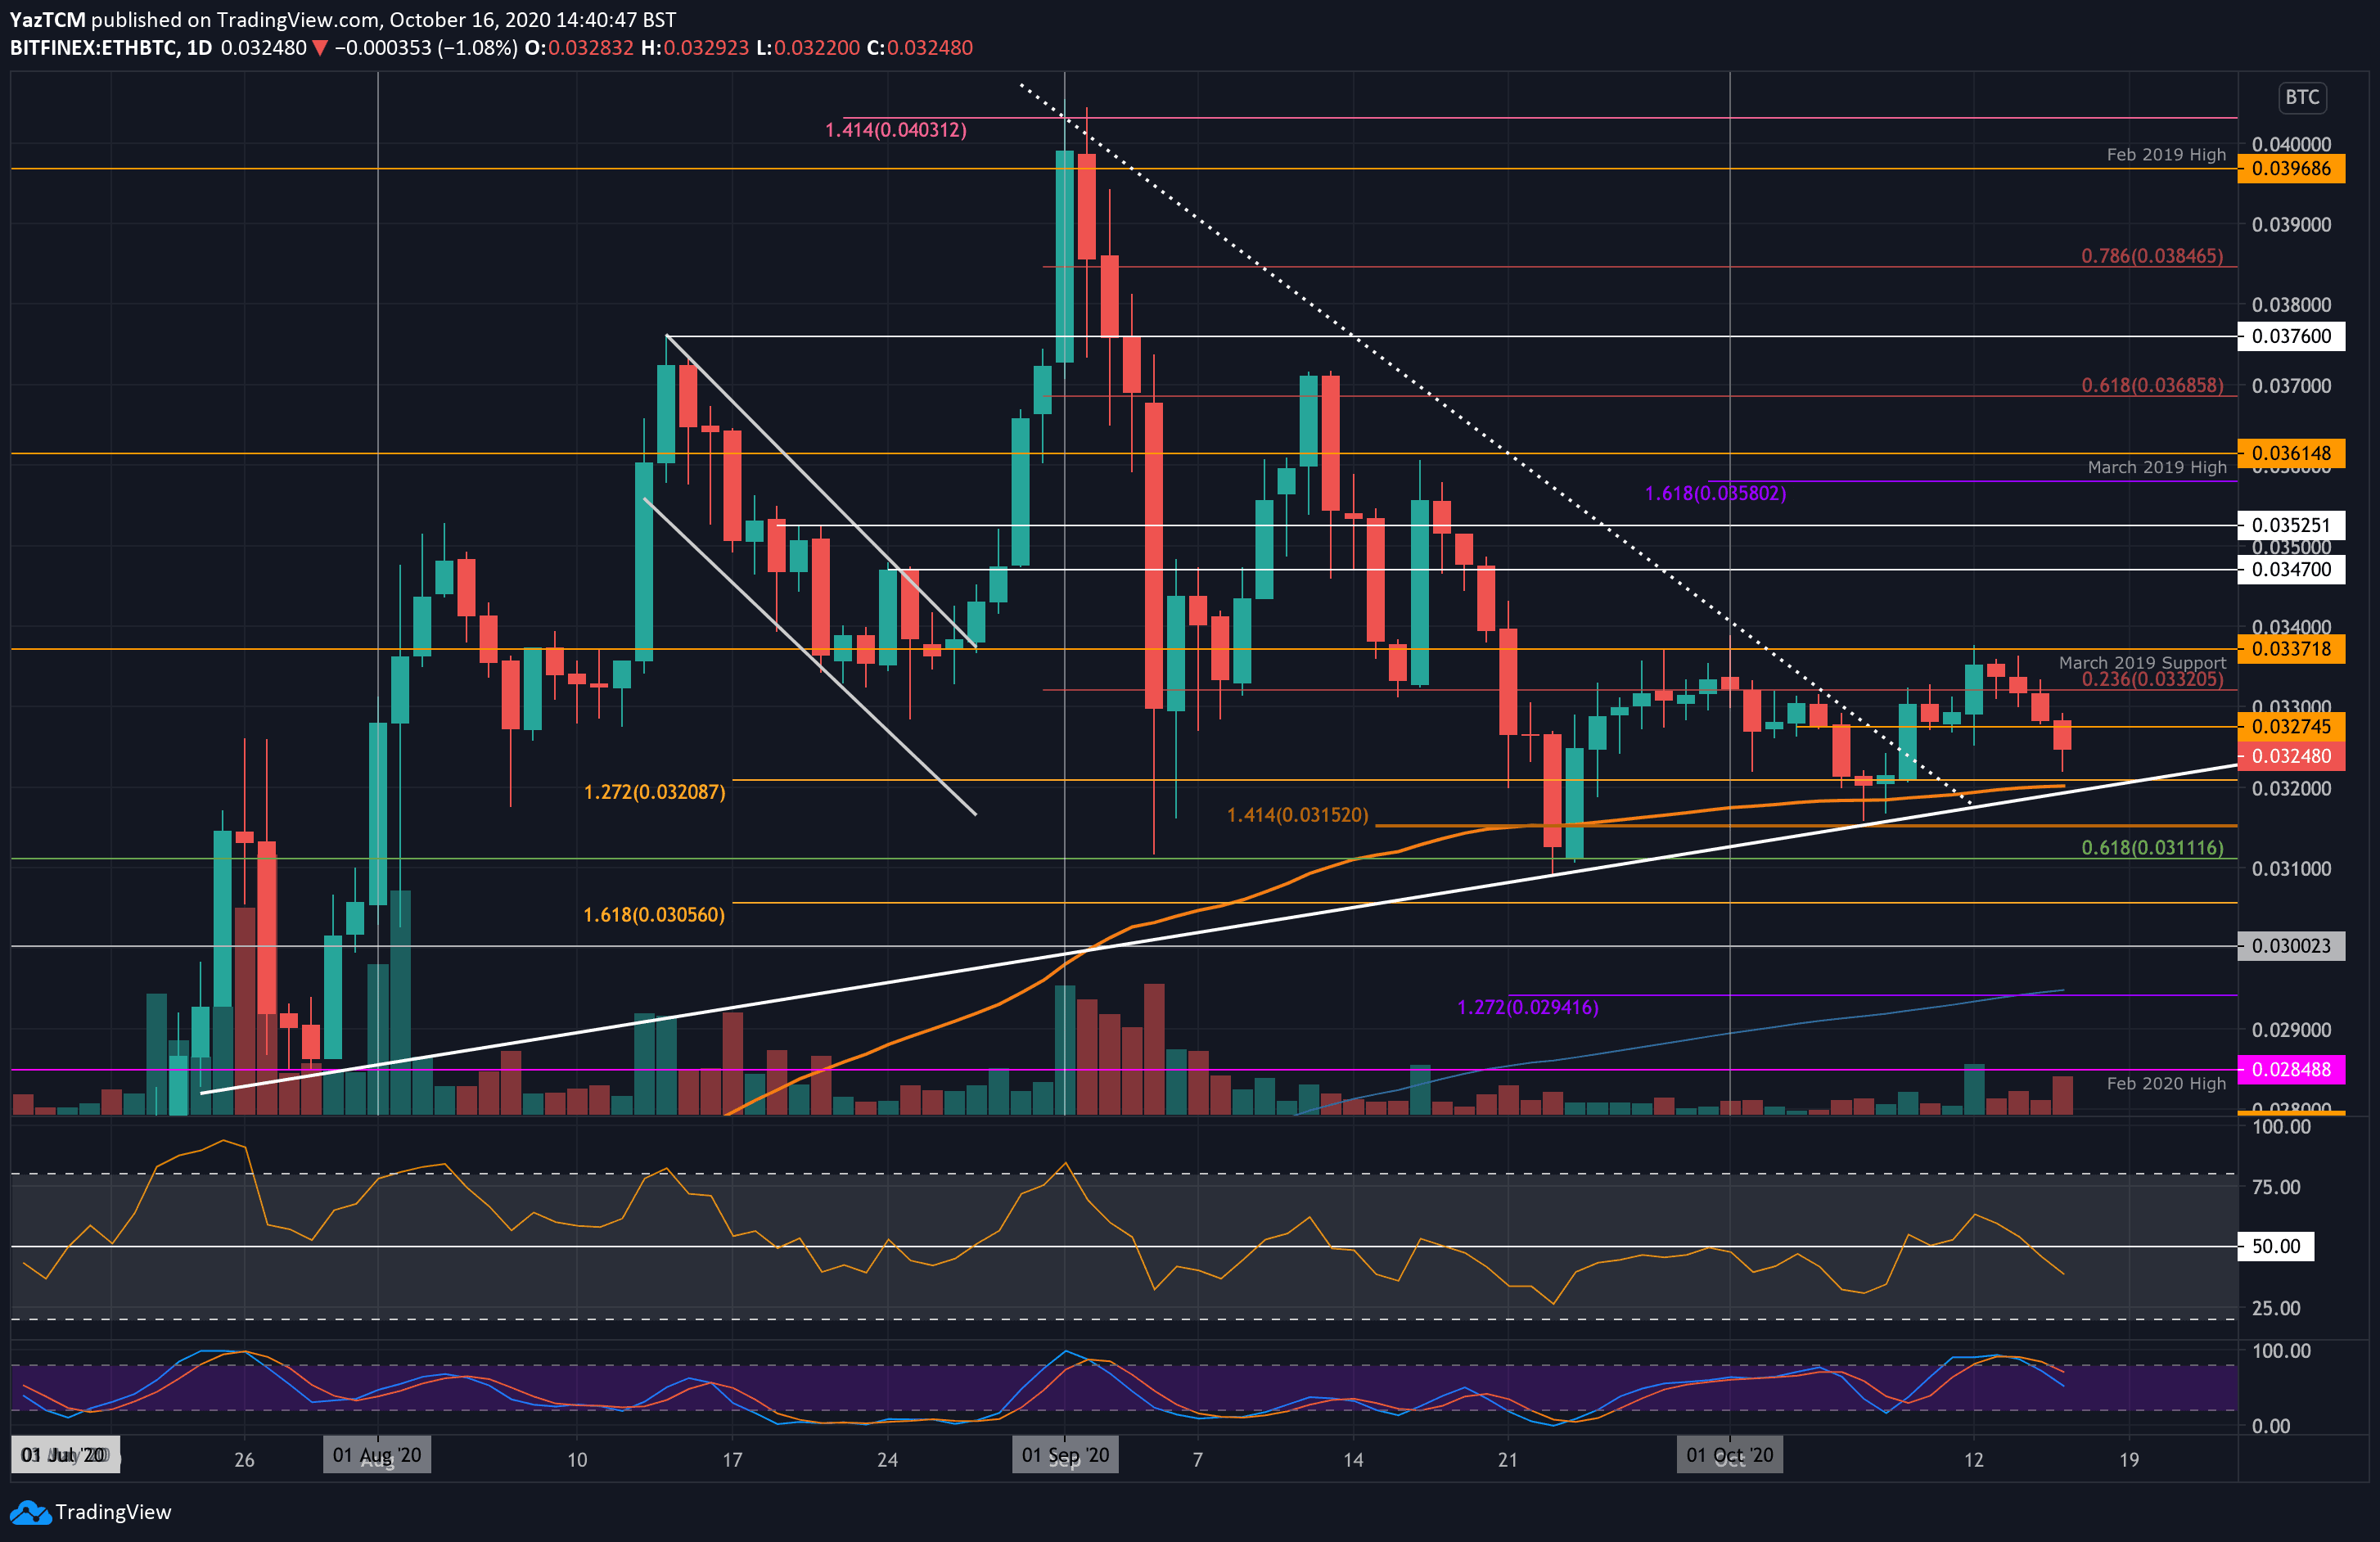
Against Bitcoin, Ethereum was trading at around 0.032 BTC last week. From there, it pushed higher to meet the resistance at 0.0337 BTC (March 2019 support – now resistance) on Monday. The sellers banded together from here and have pushed the coin lower during the week to trade at 0.0324 BTC today.
Moving forward, if the sellers continue lower, strong support lies at 0.032 BTC. The support here is provided by the 100-days EMA and is further bolstered by a 2-month-old rising trend line. Beneath 0.032 BTC, support is expected at 0.0315 BTC, 0.0311 BTC (.618 Fib), and 0.0305 BTC.
On the other side, resistance lies at 0.0327 BTC. Above this, resistance lies at 0.033 BTC, 0.0332 BTC (bearish .236 Fib), and 0.0337 BTC (March 2019 support). Additional resistance lies at 0.034 BTC and 0.0347 BTC.
Ripple
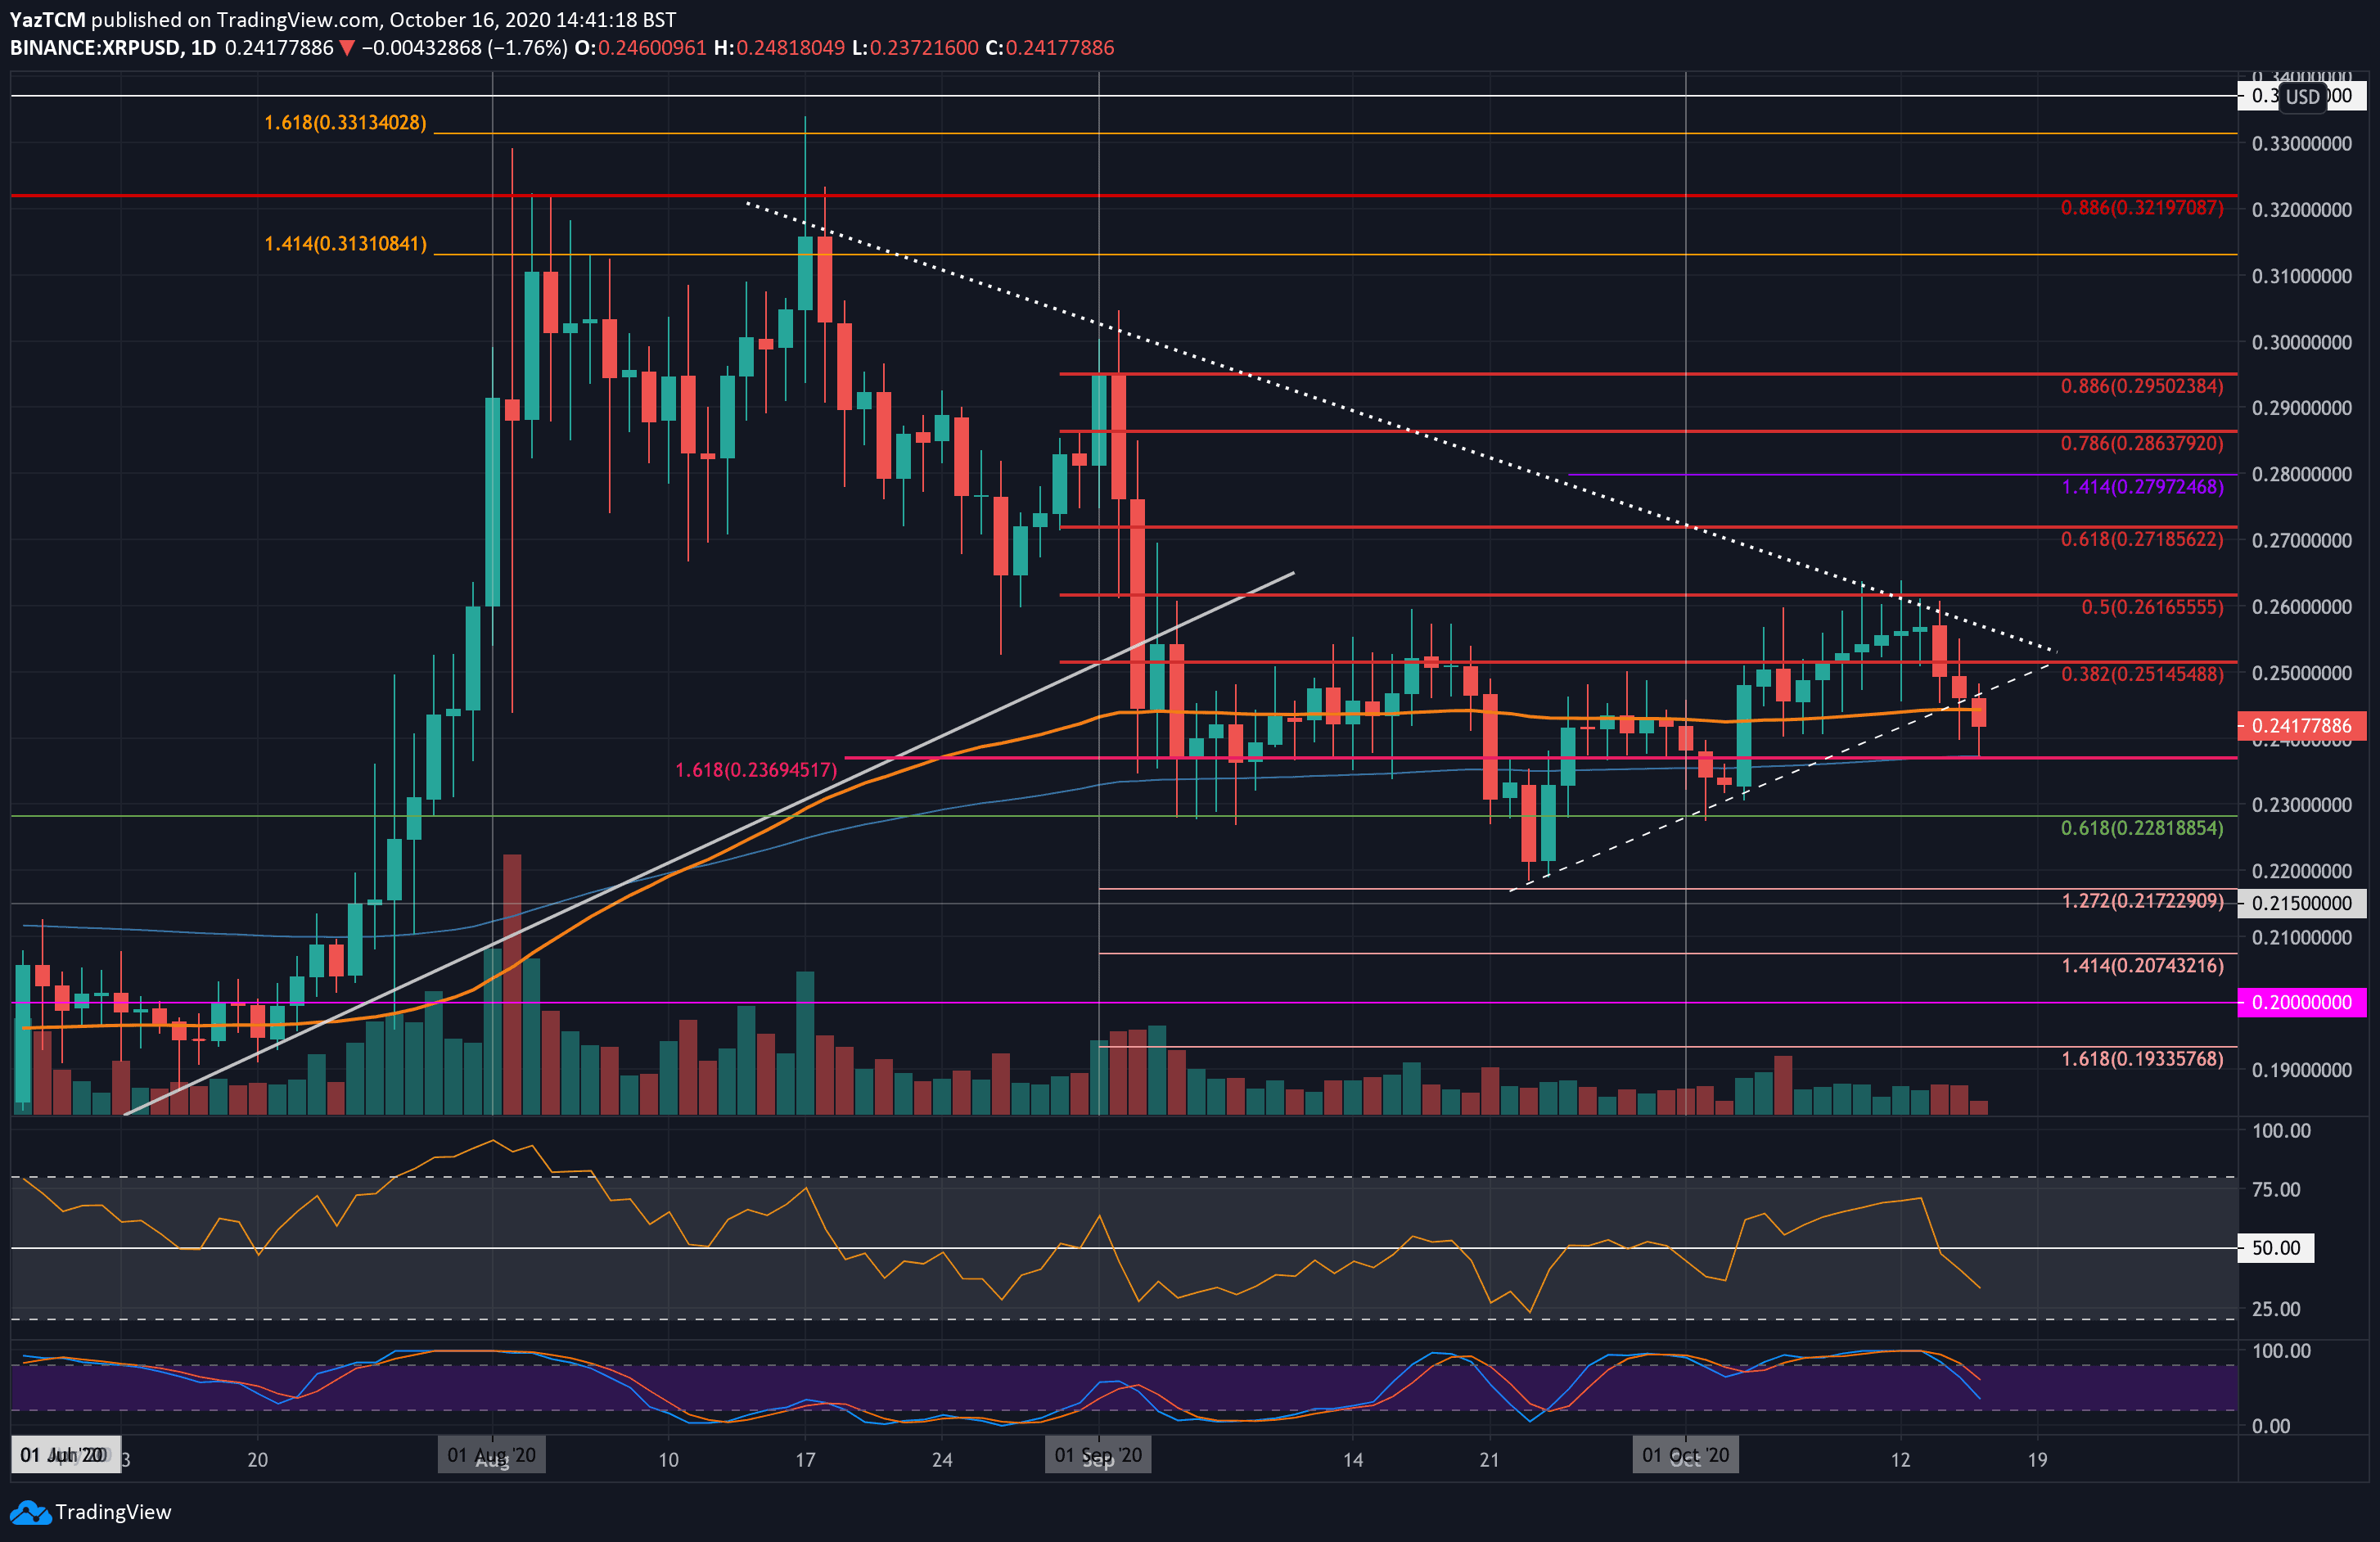
XRP witnessed a 3.6% price fall this week. The coin was trading at the $0.251 level seven days ago as it attempted to push higher. Unfortunately, it could not overcome the resistance at a falling trend line, which caused the coin to roll over three days ago.
Since reversing, XRP dropped into the support at the lower boundary of the triangle yesterday and plummeted beneath it today as it fell into the support at $0.237 (200-days EMA). It has since bounced higher slightly as it trades at $0.241.
Looking ahead, if the sellers push lower again, the first level of support lies at $0.24. This is followed by support at $0.237 (200-days EMA), $0.23, and $0.228.
On the other side, resistance now lies at the 100-days EMA. This is followed by resistance at $0.251, $0.261, and $0.271.
XRP is struggling heavily against Bitcoin after dropping by 7.2% this week. It was trading at 2300 SAT seven days ago but had been falling from here throughout the week. Yesterday, XRP plunged beneath the September lows at 2150 SAT and continued further lower today as it reached the 2130 SAT LEVEL.
If the sellers continue to drive XRP lower, the first level of support lies at 2111 SAT. Following this, support lies at 2100 SAT, 2085 SAT (downside 1.272 Fib), 2050 SAT (downside 1.414 Fib), and 2000 SAT.
On the other side, resistance first lies at 2150 SAT. Above this, resistance is located at 2200 SAT and 2250 SAT.

WAVES
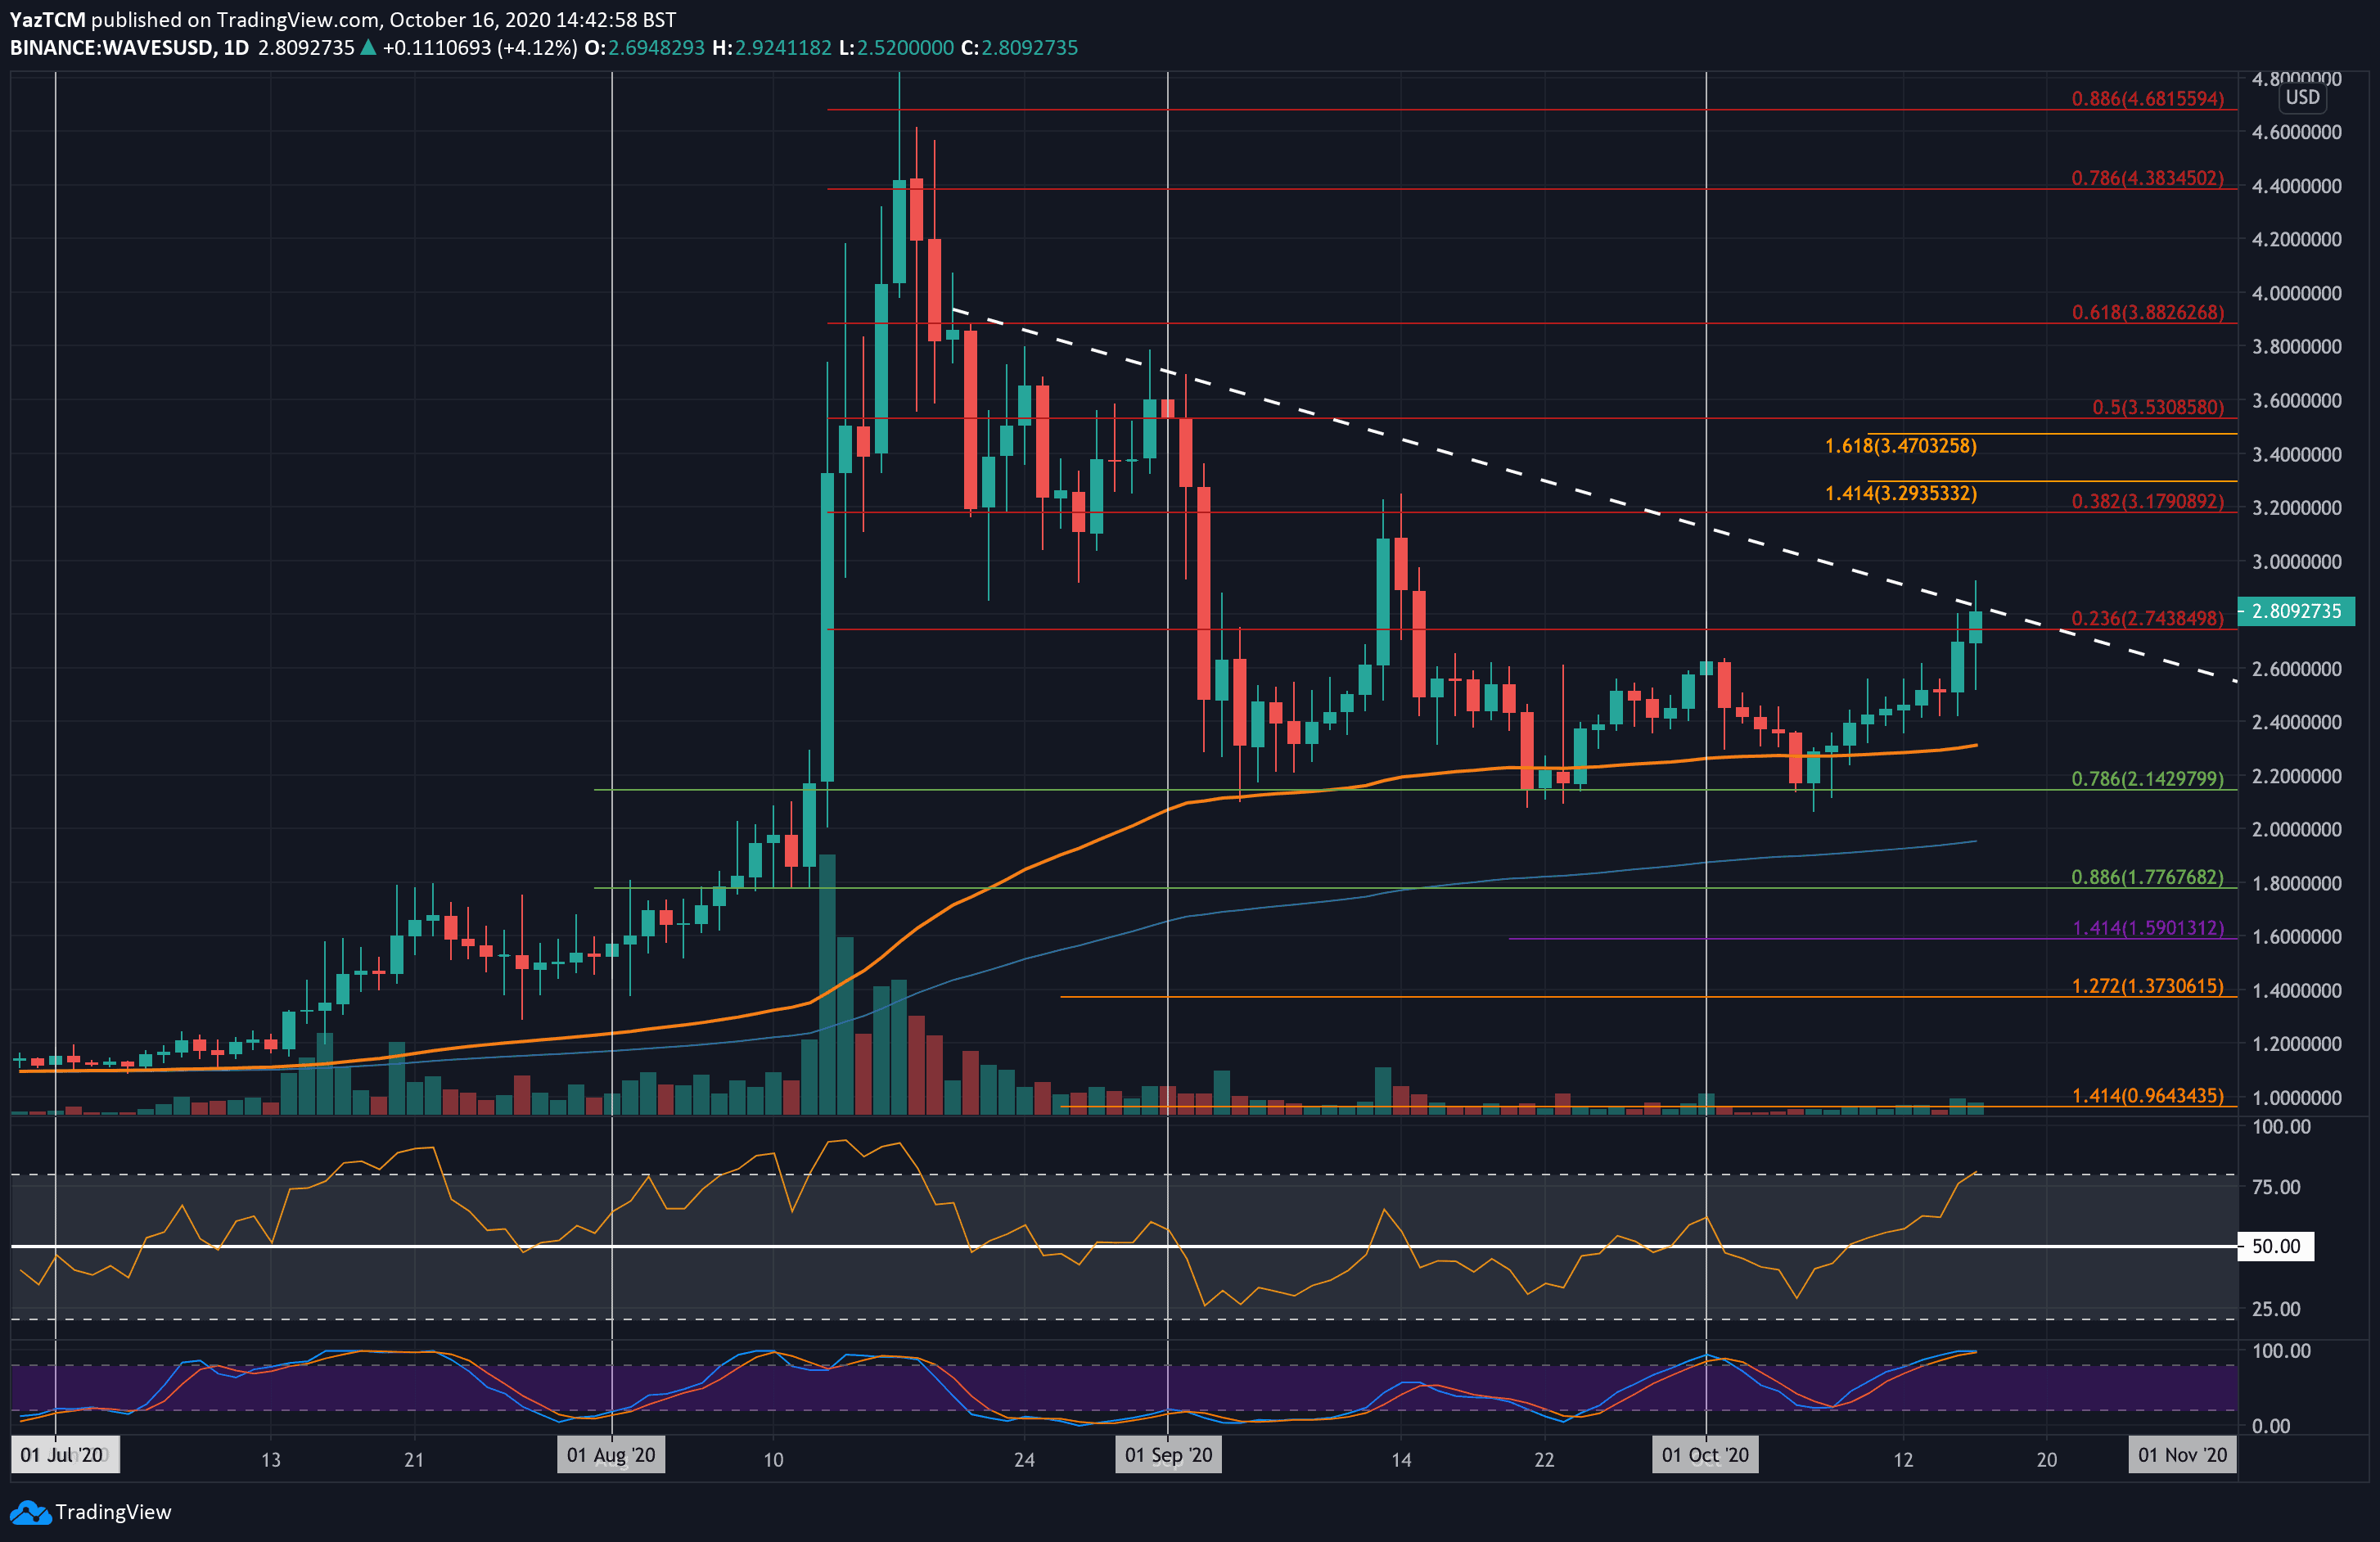
Waves witnessed a strong 22.5% price increase over the past seven days. Waves broke above the 100-days EMA at $2.30 last week and has been climbing from there.
Yesterday, it hit resistance at a bearish .236 Fib Retracement at $2.75, but the coin continued further higher in today’s trading session to hit $2.80. It is now facing resistance at a 2-month-old falling trend line and must overcome this to continue.
Looking ahead, if the buyers break the falling trend line, resistance lies at $3.00. Above this, resistance is located at $3.17 (bearish .382 Fib), $3.30 (1.414 Fib Extension), and $3.50 (bearish .5 Fib).
On the other side, the first level of support lies at $2.75. Beneath this, support is found at $2.60, $2.50, and $3.30 (100-days EMA).
Against Bitcoin, Waves has also surged higher this week. It was trading at the 100-days EMA at around 21,000 SAT last Friday as it started to push higher. Today, Waves penetrated above resistance at a bearish .236 Fib at 24,500 SAT and continued into resistance at a 2-month-old falling trend line.
Looking ahead, if the bulls can break above the falling trend line, the first level of resistance is expected at 26,760 SAT. Above this, resistance lies at 27,500 SAT (bearish .382 Fib), 28,750 SAT (1.618 Fib Extension), and 30,000 SAT (bearish .5 Fib).
On the other side, support is first expected at 24,000 SAT. Beneath this, support lies at 22,200 SAT, 21,000 SAT (100-days EMA), and 20,180 SAT.

REN
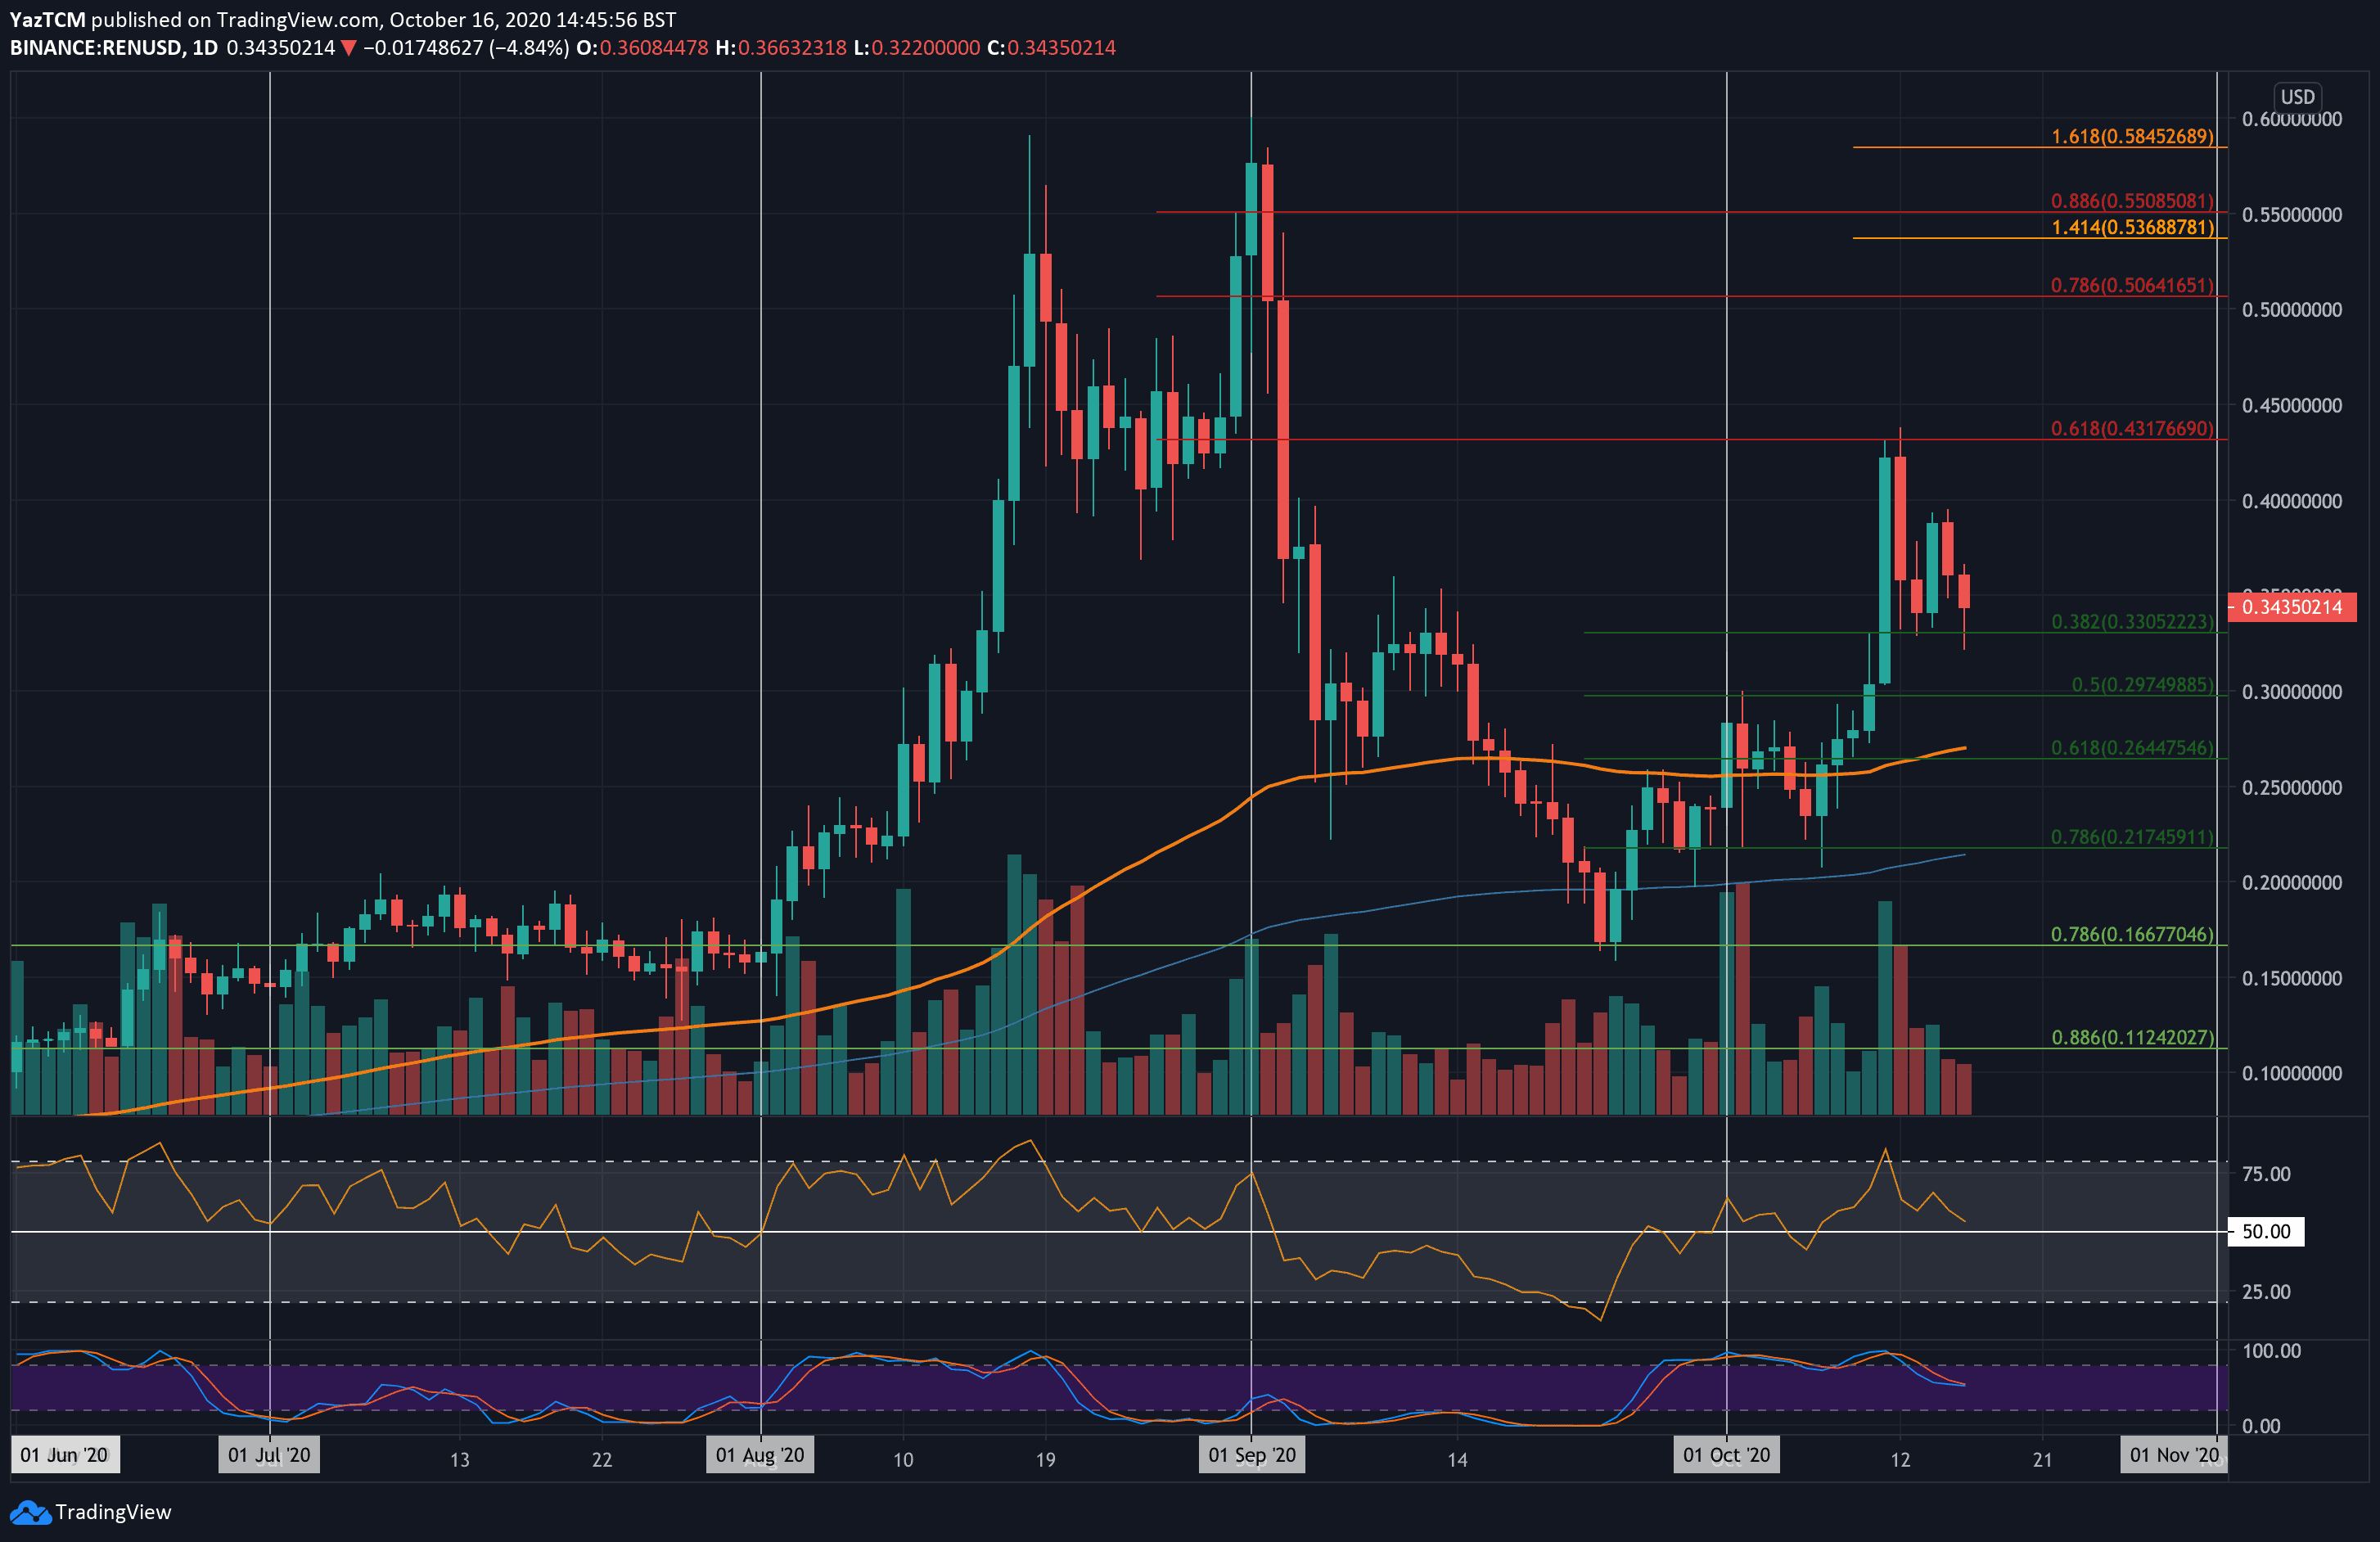
REN also witnessed a strong 26% price surge this week. It was trading beneath the $0.27 level toward the end of last week as it started to explode much higher. It reached the resistance at $0.431 (bearish .618 Fib Retracement) on Sunday and rolled over from there.
REN has since dropped lower but is above the support at $0.33 (.382 Fib).
Moving forward, if the bulls continue to defend $0.35 and push higher, the first level of resistance lies at $0.4. Above this, resistance is located at $0.431 (bearish .618 Fib). Above this, resistance is located at $0.45, $0.50 (bearish .786 Fib), and $0.53 (1.414 Fib Extension).
On the other side, support is first located at $0.33 (.382 Fib). Beneath this, support lies at $0.3 (.5 Fib), $0.264 (.618 Fib & 100-days EMA), and $0.25.
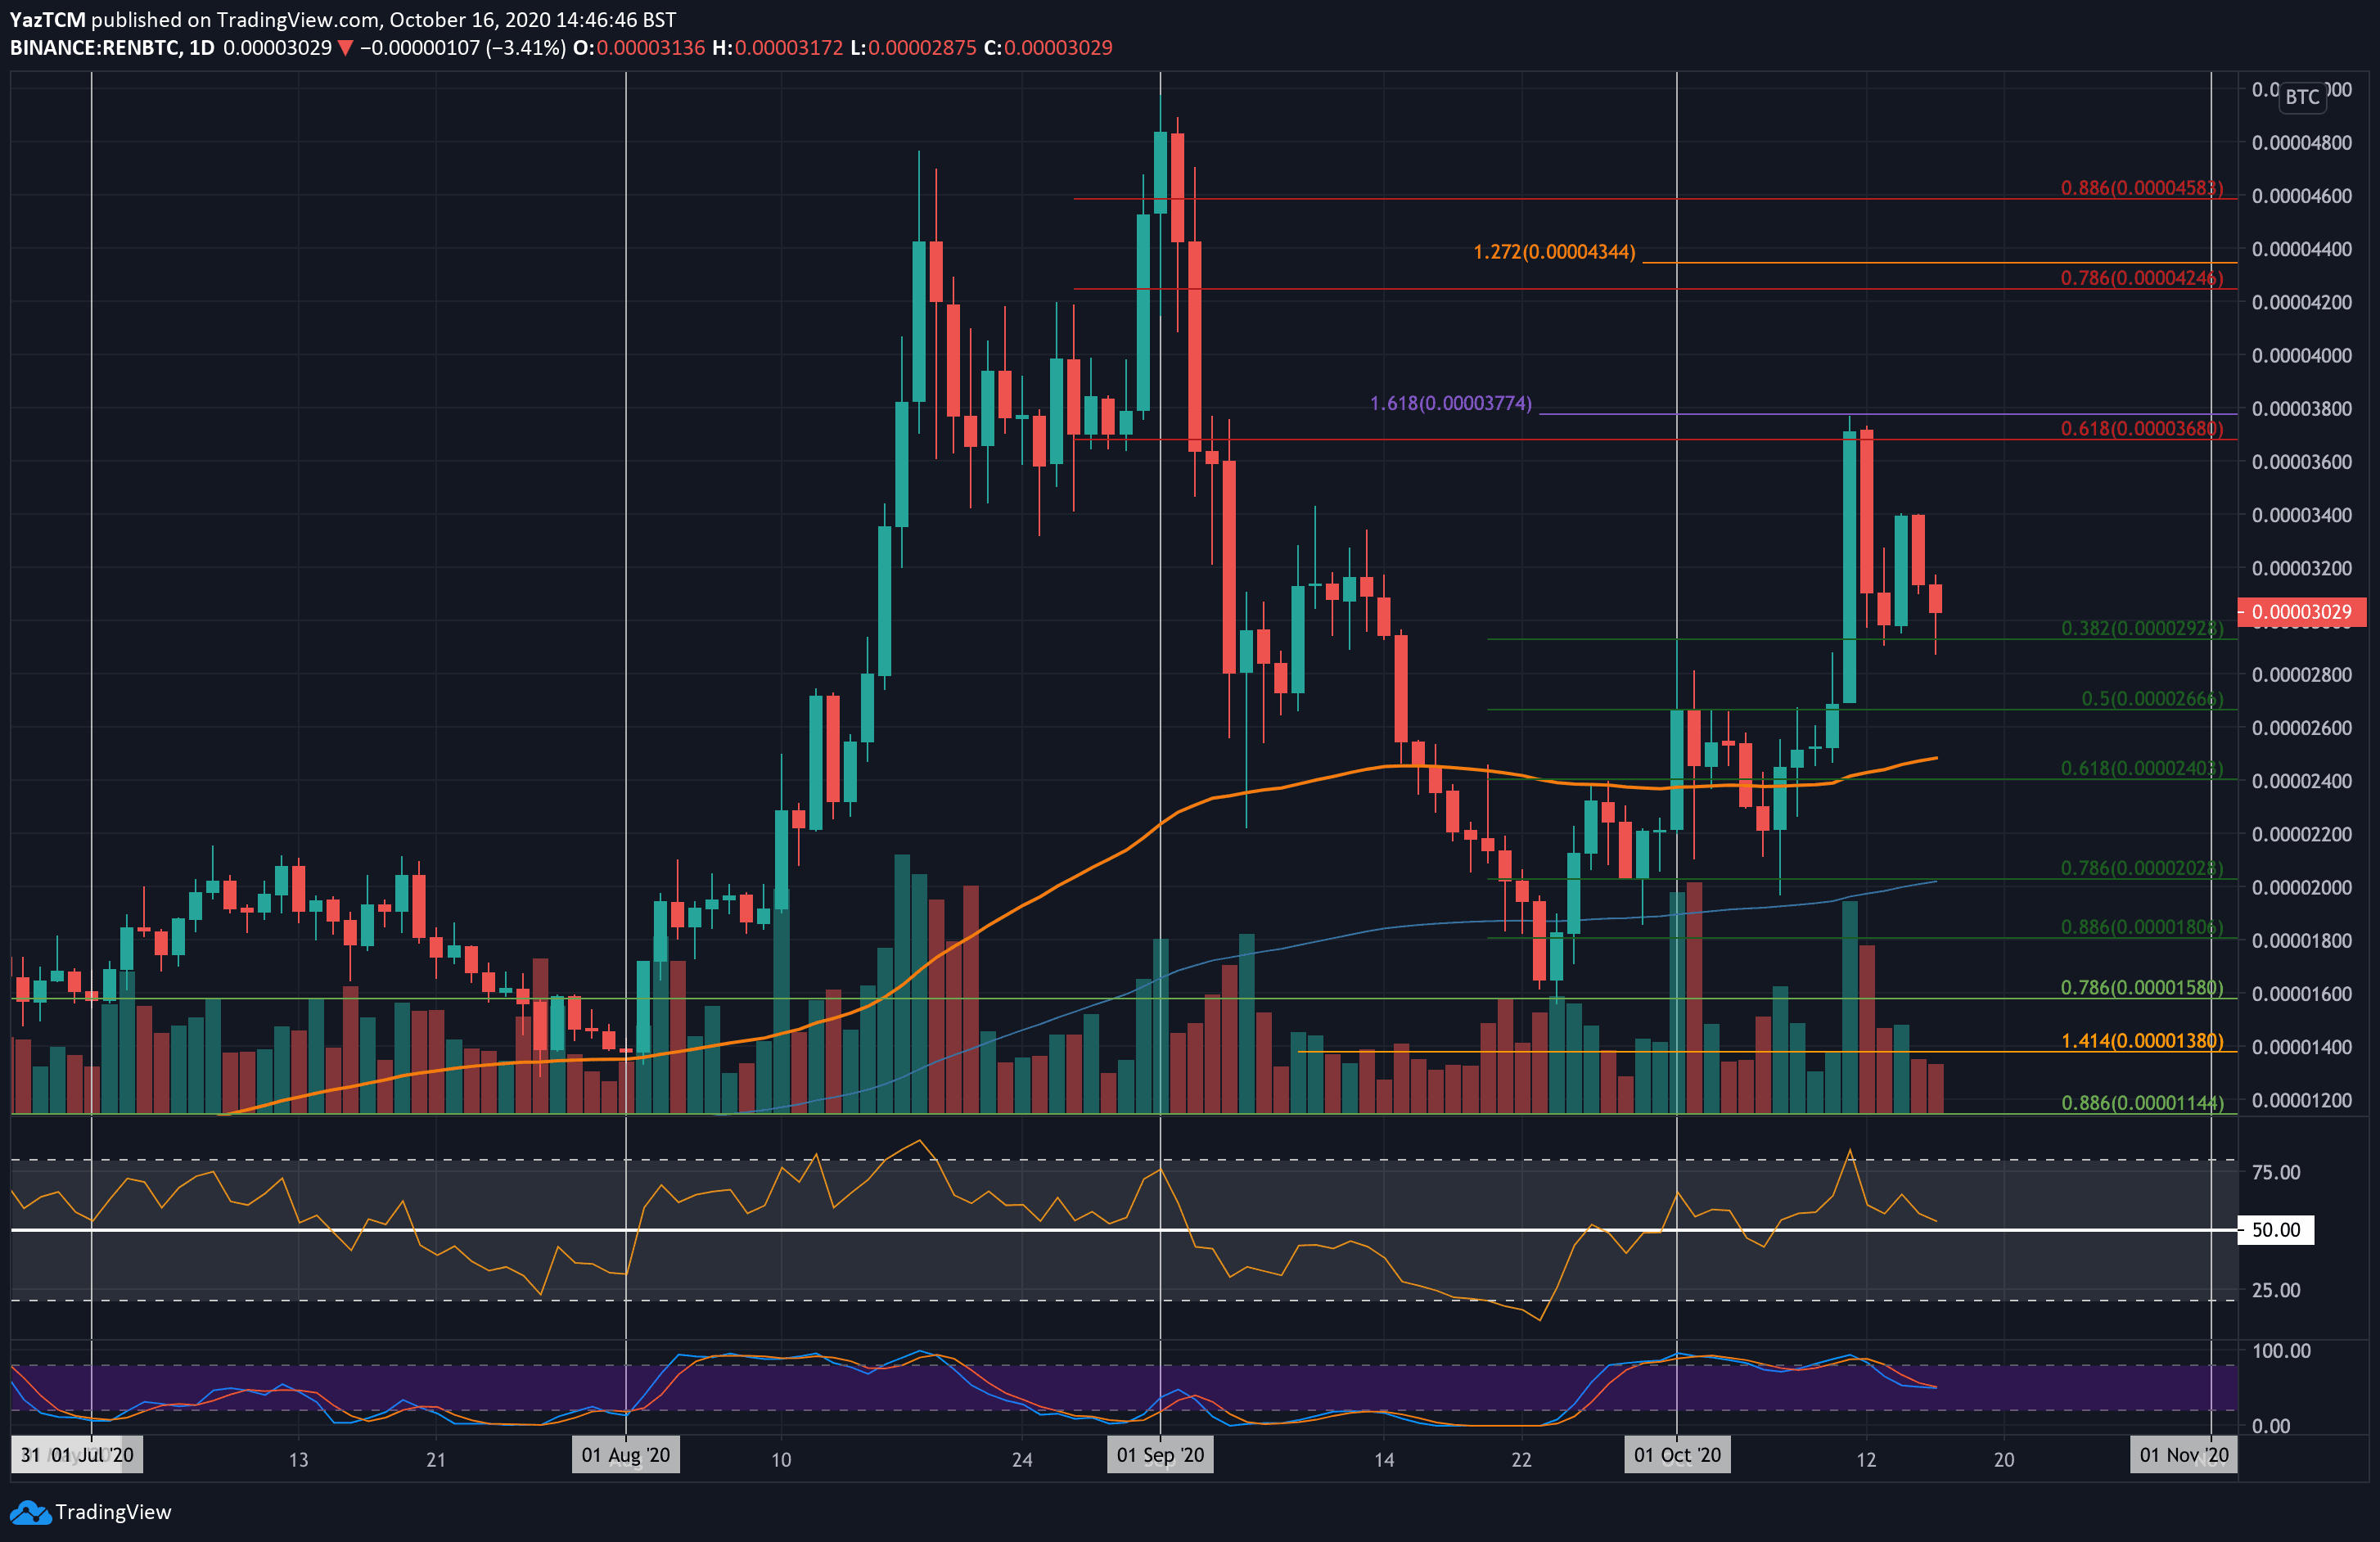
REN is performing well against Bitcoin. It was trading around 2500 SAT last Friday as it started to push higher throughout the weekend. On Sunday, it managed to break resistance at 3680 SAT to hit the resistance at 3775 SAT (1.618 Fib). From there, REN has dropped lower but managed to hold above the .382 Fib Support around 3000 SAT.
Looking ahead, if the buyers can rebound from 3000 SAT, resistance lies at 3400 SAT, 3680 SAT (bearish .618 Fib), and 3775 SAT (1.618 Fib Extension). Beyond this, resistance is located at 4000 SAT and 4250 SAT (bearish .786 Fib Retracement).
On the other side, if the sellers push beneath 3000 SAT, the first level of support lies at 2800 SAT. Beneath this, support lies at 2666 SAT (.5 Fib), 2500 SAT (.100-days EMA), and 2400 SAT (.618 Fib).
Binance Futures 50 USDT FREE Voucher: Use this link to register & get 10% off fees and 50 USDT when trading 500 USDT (limited offer).
Disclaimer: Information found on CryptoPotato is those of writers quoted. It does not represent the opinions of CryptoPotato on whether to buy, sell, or hold any investments. You are advised to conduct your own research before making any investment decisions. Use provided information at your own risk. See Disclaimer for more information.
The post appeared first on CryptoPotato


